Research Article | | Peer-Reviewed

Spatial Based Analysis of Internally Displaced People in The Case of East Harerge Zone, Oromia Region, Ethiopia

Received: 3 October 2024     Accepted: 29 October 2024     Published: 28 November 2024
Views:       Downloads:
Abstract

Internally displaced persons (IDPs) are individuals or groups forced to flee their homes due to human-induced or natural causes. This study aims to analyze IDPs in East Harerge Zone using Geographic Information System, focusing on spatial aspects of internal displacement. The research examines the causes, hotspot areas, spatial patterns, trends, and statistics of displacements in the Zone. A mixed research approach was employed to understand the contextual situation of IDPs, incorporating their own meanings, experiences, and challenges. Primary data sources included observations and key informant interviews with Zonal, Woreda Disaster Risk Management Office (DRMO) officials, and humanitarian workers in East Harerge. Secondary data sources comprised published and unpublished documents such as Displacement Tracking Matrix (DTM) datasets from 2017-2022, humanitarian reports, journals, books, administrative boundary data, and IDP population figures. The study reveals a high number of displacements in East Harerge Zone from 2017 to 2022, with IDPs originating from 15 out of 24 Woredas (63%) and displaced to various locations within the country, including Dire Dawa, Somali Region, and other regions. Conversely, IDPs were also displaced to East Harerge Zone from the Somali region, residing in 22 out of 24 Woredas (92%). The spatial distribution of displacement, causes, hotspot areas, and existing IDP sites were discussed in a spatial context using ArcGIS software. The causes of displacement were analyzed in conflict, drought, and flood-induced bases. Therefore, this study will be an input for All disaster risk management offices starting from National to Woreda level to make better decision and policy to strengthen spatial bases disaster management mechanism using GIS and remote sensing technologies.

Published in Journal of Health and Environmental Research (Volume 10, Issue 4)
DOI 10.11648/j.jher.20241004.14
Page(s) 114-133
Creative Commons

This is an Open Access article, distributed under the terms of the Creative Commons Attribution 4.0 International License (http://creativecommons.org/licenses/by/4.0/), which permits unrestricted use, distribution and reproduction in any medium or format, provided the original work is properly cited.

Copyright

Copyright © The Author(s), 2024. Published by Science Publishing Group

Keywords

Internal Displacement, Internally Displaced People, Spatial Distribution, Hotspot Areas, Displacement Tracking Matrix

1. Introduction
Globally internal displacement has become one of the greatest human tragedies in the world today. Based on International Disaster Monitoring Center (IDMC) report; conflict, violence and disasters triggered 38 million internal displacements across 141 countries and territories in 2021, the second highest annual figure in a decade after 2020's record-breaking year for disaster displacement. Conflict and violence triggered 14.4 million movements, an increase of almost 50 per cent compared to the year before .
Internal displacement means the involuntary or forced movement, evacuation or relocation of persons or groups of persons within internationally recognized state borders. Internally displaced persons (IDPs) are people or groups of individuals who have been forced to leave their homes or places of habitual residence, in particular because of, or to avoid the effects of armed conflict, situations of generalized violence, violations of human rights, or natural or man-made disasters, and who have not crossed an international border . This concept incorporates both the involuntary or coerced nature of the movement, and the movement takes place within national borders; and Internally Displaced Persons means persons or groups of persons who have been forced to leave their homes or places of habitual residence, either natural or human induced disasters. Internally displaced persons are distinct from refugees who are displaced outside their national borders. Furthermore, IDPs compared to refugees are often more disadvantaged since they do not access assistance provided by international agencies unless such assistance is requested by the national government
Africa has consistently been the region most affected by displacement associated with conflict and violence; accounting over one-third of the global forced displacement population over the past decade . According to Africa Center for Strategic Studies report in 2022 the number of forcibly displaced people (internally displaced, refugees, asylum seekers) in Africa continued its uninterrupted escalation over the past decade expanding by 12 percent (3.7 million people) in the past year. Reports indicate that conflict-induced displacements largely related to ethnic and border-based disputes are common in Ethiopia. In April and later in June 2018, conflict between Gedeo and Guji Oromo tribes in West Guji broke out due to competition for land and resources. Simultaneously, a localized conflict in Benishangul Gumuz region and the East and West Wellega zones of Oromia region displaced an estimated 191,995 IDPs . It is a fact that internal displacement is a serious problem in Ethiopia today than ever and has also remained pervasive throughout Ethiopian history. Persons or groups who have been forced to flee their homes and habitual residences unexpectedly in large numbers are increasing in the recent time than ever before due to communal violence or ethnic tensions and governance crises .
Accordingly, as of report 3.6 million persons were displaced due to conflict and violence and 579,000 persons were internally displaced in the country due to disasters. Conflict and violence triggered more than three times the number in 2020 and the highest annual figure ever recorded for a single country. Looking at regional figures in Ethiopia from 2018 through 2020/21, the highest numbers of IDPs were recorded in the Oromia region largely due to conflict followed by the Somali region due to conflict and climate induced displacement . Oromia is the region with severe food insecurity accounting for around 52% of the people who need food assistance. Internally displaced persons are mainly exposed to protection risks and are disrupted in their education and vocational training. Besides, lack of access to safe water and sanitation joined with poor hygiene practices continue to pose disease outbreak risks in parts of the country .
Geographic Information System are useful for decision making and planning on internal displacement locations, causes of displacement, hotspot areas and spatial distribution either on the displaced people or in the host community. GIS is fundamental for improving quality of the data and analyzing it for operational use, which makes it easier for the government, humanitarian worker, policy developers and other decision makers .
2. Material and Methods
2.1. Study Area
The study was conducted in East Harerge zone, one of the 20 zones of Oromia Regional state located in the eastern part of the country. Geographically, it is situated between latitude 7° 32’- 9° 44’ North latitude and 41° 10’- 43° 16’ East longitudes covering a total area of 24,933 km2 (Figure 1). The zone is bordered with West Harerge Zone from the west, Bale Zone from the south, Somali regional state from the East and Southeast, and Dire Adwa administrative council from the North. The capital of East Harerge is Harar which is located at 521Kms from the national capital Addis Ababa. The zone is further divided into 20 rural and 4 urban woredas. East Harerge zone is the highest populated zone of the region with an estimated total population of 3,858,569 (1,945,863 male and 1,912,705 female) projected from CSA 2007 census (Table A2). The total area of the zone is 23,525 km2 with a population density of 148.5 persons per kilometer square. The population pressure resulted in very small land holding size per household. East Harerge CSA Estimated Population showed that the demography of East Harerge Woreda’s. The zone has two main drainage basins, namely the Wabishebele and Awash drainage basins. Due to the topography and hydro-geological condition, east Hararghe is a water resource scarce area . It is characterized by plateaus, rugged mountains, deep gorges, and flat plains. The altitude ranges from 500 to 3,400 meters above sea level. The zone contains three agro-ecological zones, highlands (elevations above 2,300 m.s.l), midlands (elevations between 1,500 and 2,300 m.s.l) and lowlands (below 1,500 m.s.l). The lowlands occupy the largest area (62.2%), followed by midlands (26.4%) and highlands (11.4%) . The average annual temperature ranges between 130 to 280C and is characterized by erratic rainfall and recurrent failure of crops. The average annual rainfall ranges between 400-1250mm. Rainfall pattern is irregular and erratic in most of the lowland woredas whereas sometimes above normal in highland areas which results in flood incidents . East Harerge zone of Oromia is classified under the bimodal rainfall receiving belt of the country which receives Belg rains from mid of February through end of May and Kirempt/Meher rains from the months of June through September. The socio-economic of the Eastern Hararghe zone is mainly dependent on crop cultivation and livestock rearing; petty trade, daily laborer and collection of firewood and charcoal are alternative livelihood activities in the zone. The agro-ecology of the zone is favorable to produce cereal crops, pulses, oil crops, vegetables, and fruits. The major crops grown in the zone are maize, sorghum, wheat, barley, and groundnut. Sorghum and maize are used as a staple food in most of the areas of Eastern Hararghe Zone. In addition, cash crops like chat and coffee as well as livestock production are widely practiced in the area. The major types of livestock produced in the zone include cattle, sheep, goats, camels, donkeys, and poultry. Even though the area receives two seasonal rainfalls and is favorable for all types of crops and livestock production, the zone is suffering from natural hazards, like drought and flood, landslides, crop pests and hailstorms, man-made hazards like conflict and land degradation . Furthermore, east Hararghe zone is one of many areas in Ethiopia that are frequently affected by recurring drought, irregular rainfall, and severe land degradation .
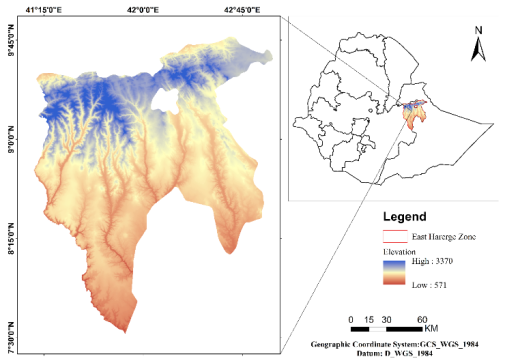
Figure 1. Location map of the study area (Source: Ethiopian Space Science and Geospatial Institute (ESSGI), ESRI).
The Belg rain is useful to produce over 20% of the annual production during the short Belg season. The Belg rain is also very crucial for land preparation of the Meher season. The Kiremt rain is the main rainy season of the area used to produce the Meher season crops which are mainly long cycles crops which cover about 80% of the annual production of households. Both rains are very decisive for the livelihood of over 85% of the rural population depending on rain fed agriculture and livestock productions. Irregularity of the onsets and cessations, intensity and coverage of these rains which is recurrently varying from time to time and place to place is very determinantal to the livelihood of the farmers who suffer from drought when the rainfall is erratic mostly in the lowlands and flooding when the rains are above normal mainly in the highland woredas of the zone. So, flooding, hailstorms, drought, frost, water logging and landslides are the recorded whether related hazards in the zone .
2.2. Data
2.2.1. Displacement Tracking Matrix Datasets
This study employed the internal displacement data that has prepared by international organization for migration (IOM) in regular bases throughout Ethiopia with integrating NDRMC Woreda and Zone DRMO offices. IOM has been preparing regular data reports on the state of Internal Displacement in Ethiopia. In Ethiopia this displacement data collection process has operational since 2012. In collecting data related to IDPs, IOM works in collaboration with the National Disaster Risk Management Commission (NDRMC) and its Regional, Zonal, and Woreda offices during the data collection and endorsements for public. The dataset on their website was prepared in round base by excel format and for this study the researcher used from round 8 up to round 31 from 2017 up to 2022. The reason used these rounds are, on their websites released from public these datasets only. Further DTM data are available on https://dtm.iom.int/ethiopia. The datasets have IDP information like causes of displacements, origin, and destination of IDPs in different levels of administration, total number of IDPs, time of displacements and their living condition after displacement. Using that information, the author integrated it into spatial format for further analysis using different GIS techniques. The other good things about these datasets are it has GPS coordinates IDP sites to show their destination and living site conditions. These datasets integrate primary data collected from key informants’ observations, and other secondary data sources the researcher used for detailed analysis of displaced people in East Harerge in spatial context and descriptive ways.
For this study the author used Woreda admin boundaries of East Harerge Zone for joining displacement datasets that collected by the DRMO and IOM DTM. The DTM dataset has locational information, and the data is prepared by excel format by categorizing level of administration by region, zone, woreda and kebele. In addition to that within this dataset the IDP site locations have been collected their GPS coordinate. Based on these significant data the spatial based information extracted for further analysis using ArcGIS software. The other GIS data that used on this study, administrative boundaries of East Harerge Zone that obtain from Ethiopian space science ad geospatial institute in shapefile format. ArcGIS allows to associate records in one table with records in another table through a common field, known as a key. On this study the researcher using the excel dataset and East Harerge Woreda shapefile made tables join operation using ArcMap by key fields in both tables. The key fields in both tables are Woreda names of the study area. Based on this operation the joined tables are using export tool converted to polygon shapefiles. On the other hand, using the GPS coordinates of IDP sites in the cleaned datasets has been converted to point shapefile using ArcGIS for further analysis . In general, after these steps the researcher prepared East Harerge Woredas point and polygon shapefiles of displacement data with spatial reference WGS 1984 Zone 37.
2.2.2. East Harerge IDP Displacement Situation Data
This research separated the displacement data into two. The first one is IDPs that displaced from East Harerge to other locations and the second one is IDPs that came from different locations to East Harerghe Woredas by the cause of human and natural induced displacements. This data was got from DTM displacement dataset from 2017 up to 2022 that collected in different round. Based on this DTM displacement assessment dataset, IDPs were displaced from different locations to East Harerge by the cause of conflict, drought, seasonal flood, and other factors. Using the collected data from DTM and Zone DRMO sources, the author has prepared displaced people place of origin in Zonal and Woreda level for further spatial analysis using and excel software for data cleaning and merging of information’s.
On the other side there are IDPs displaced from East Harerge Woredas to different locations by the causes of human and natural induced factors of displacement. The main causes of displacement from East Haregre in the past 6 years are conflict, drought, seasonal flood, and other factors. In addition to that, after displacement the living situations of IDPs have been prepared for further analysis of this study. That means IDPs after displaced from their place of origin they live together in camp and camplike settings, in host community by renting houses, in collective centers and other public services areas.
2.3. Data Collection Instrument
The study has employed both primary and secondary data sources. The primary data sources were collected from key informants at East Harerge Zone, Deder, Goro Gutu, Kersa, Babile, Chinaksen, Meta, Gursum, Fedis, and Midhega Tola Woreda disaster risk management officials and humanitarian organizations using Kobo toolbox. The Key informants who had good knowledge of the issue under study were interviewed within the Zone, Woreda DRMO officials and humanitarian workers. A total of 20 key informants were selected and interviewed for this study. The other primary data sources were observation of currently exiting IDP sites in East Harerge Woredas. Secondary data for the study include both published and unpublished documents of Displacement Tracking Matrix (DTM) dataset from 2017 to 2022, humanitarian published reports, journals, books, administrative boundary data and IDP population figures.
2.4. Key-Informant Interview
According to , key informants are people who know a lot about the topic under study and who are willing to share their knowledge with the researcher. For this study a total of 20 key informants who have better information about the displacements in this Zone and Woredas were interviewed. Individuals who work at disaster risk management, coordination of displaced peoples, officials and Humanitarian organizations experts working at East Harerge Zone and Woredas were interviewed as key informants because such persons have good knowledge about the cause and consequences as well as their current living situations of displaced people. To get more information about far Woredas like Meyu Muluke, Golo Oda, Melka Belo and other Woredas the researcher got the information from zonal DRMO office. The author recorded those informants who were willing to give information on Kobo toolbox designed interview questions and notebooks to obtain interview data, particularly for those who were unwilling to give information through Kobo toolbox.
3. Methodology
Three different approaches to social science research: qualitative, quantitative, and mixed were identified by . This study employed a mixed approach. Mixed-methods research (MMR) is a research methodology that incorporates multiple methods to address research questions in an appropriate and principled manner which involves collecting, analyzing, interpreting, and reporting both qualitative and quantitative data . This study employed both qualitative and quantitative research methods. On this study the qualitative methods were by collecting key informant interview, observation at IDP sites of East Harerge and the DTM displacement datasets. In terms quantitative methods the researcher collected numeric information from DRMO, DTM displacement dataset and other secondary data sources. This quantitative data showed that number of displaced peoples, numbers of Woredas were affected, and number of currently exiting IDP sites and other related information’s. So, by mixing these two methods the researcher clearly understands the contextual situations of displacement in East Harerge Zone for the last six years.
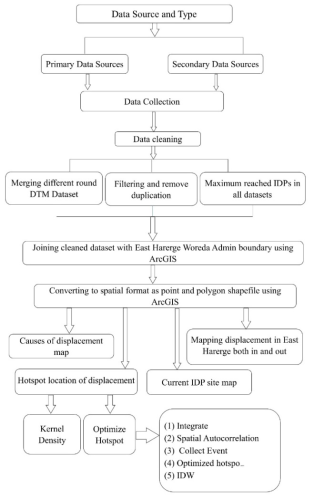
Figure 2. Summarized flowchart research design (Source: Own Construction, 2023).
3.1. Data Processing and Analysis
Both the primary and secondary data sources have been used to analyses and prepare the map of all displacement information within East Harerge Zone. Analysis is the search for patterns in data and for ideas that help explain why those patterns are there in the first place . The research method has been descriptive because the study was attempted to describe and explore the main contributing factors of internal displacement, high displacement exiting location identification and spatial trends of internal displacement using GIS technologies. To do this analysis and maps different software’s like ArcGIS, excel, and Kobo toolbox has been used to prepare the causes of displacement, displaced people located areas, hot spot areas of displacement, statistical information of displacement like maximum reached IDPs, living standard of IDPs after displacements and other related information’s.
The author has used arc toolbox tool in ArcGIS software to conduct, join, clip and conversion from excel to shapefile, hotspot analysis, and other. Excel tool is the other essential software for this study during the dataset preparation. To merge different time DTM datasets, the researcher has been using excel software for data cleaning and other statistical analysis using pivot table and other excel tools. After organizing and cleaning the dataset have prepared tabular data and shapefiles of the study area for further analysis using excel and GIS software. Based on this, spatial based cause of displacement, hotspot areas of displacement, and spatial trends of displacement within the study area were produced.
3.2. Data Cleaning
Data cleaning is the process of fixing or removing incorrect, corrupted, incorrectly formatted, duplicate, or incomplete data within a dataset. When combining multiple data sources, there are many opportunities for data to be duplicated or mislabeled. If data is incorrect, outcomes and algorithms are unreliable, even though they may look correct. The datasets were very bulky that was collected in the past 6 years by IOM with integrating Ethiopian Disaster Risk Management office. Since it was collected country wide, the researcher filtered out the East Harerge displacement information using excel. The dataset has where the IDPs came from to East Harerge and where the IDPs displaced to other location from East Harerge. Based on that, the duplicated information was identified and removed after filtering. To remove the duplicated data, I used IDP site names as a key field with integrating Zone and Woreda admin names.
3.3. Converting Dataset to Point Shapefile
The cleaned displacement datasets have latitude, longitude, and admin boundaries of the IDPs. In addition to data sources, such as a shapefile, you can add tabular data that contains geographic locations in the form of latitude and longitude to the map. Latitude and longitude describe points on the earth's surface such as the location of IDP sites and place of origin during and after displacement. After preparing the cleaned dataset and saving it as CSV (comma separated values) file format using excel. The latitude and longitudinal value were displayed the IDP locations by exporting to point shapefile with spatial reference to WGS 1984.
3.4. Joining Cleaned Datasets
Joining data is typically used to append the fields of one table to those of another through an attribute or field common to both tables. To define the join, choose based on either attributes or a predefined geodatabase relationship class or by location (also referred to as a spatial join). Several tables or layers can be joined to a single table or layer, and relationship class joins can be mixed with attribute joins. The data joining process is often a prerequisite for mapping and spatial analysis. For this study the clean dataset and the East Harerge Woredas admin boundary shapefile joined by using common filed names. For this join process, Woreda field name were used in both tables and exported as East Harerge Woreda IDP shapefile.
3.5. Hotspot Analysis
Hotspot analysis is a spatial analysis and mapping technique interested in the identification of clustering of spatial phenomena. These spatial phenomena are depicted as points on a map and refer to locations of events or objects. To conduct the hotspot analysis this study has used Kernel density and Hotspot analysis tools from arc toolbox of ArcGIS.
3.6. Kernel Density
The Kernel Density tool calculates the density of features in a neighborhood around those features. It can be calculated for both point and line features. Possible uses include analyzing density of displacement and IDP sites within the study areas. For this study cleaned dataset of internal displacement from 2017 up to 2022 were used as source of this analysis. The following formulas define how the kernel density for points is calculated and how the default search radius is determined within the kernel density formula.
The predicted density at a new (x,y) location is determined by the following Eq. (1).
Density= 1radius2i=1n[3*popi(1-(disiradius)2)2 (1)
For disti < radius
Where:
i = 1, n are the input points. Only include points in the sum if they are within the radius distance of the (x,y) location
pop is the population field value of point I, which is an optional parameter.
dist is the distance between point i and the (x,y) location.
3.7. Optimized Hot Spot Analysis (Spatial Statistics)
For this study Optimized Hot Spot Analysis executes the Hot Spot Analysis (Getis-Ord Gi*) tool using parameters derived from characteristics of displacement locations data. To do this analysis the researcher used the displacement location data from East Harerge to other locations on the cleaned dataset from 2017-2022. The data was in excel format and converted to CSV. Using the CSV file and ArcGIS software the displacement locations converted to point shapefile by the latitude and longitude values of the dataset. After converting to shapefile using Integrate (Data Management) tool the displacement location point data were integrated within 1000 meters. Integration is a tool that is used to analyze the coordinate locations of feature vertices among features in one or more feature classes. Those that fall within a specified distance of one another are assumed to represent the same location and are assigned a common coordinate value (in other words, they are collocated) . After integrated the point data has conducted spatial autocorrelation based on feature locations and attribute values using the Moran's I statistic.
The Spatial Autocorrelation (Global Moran's I) tool measures spatial autocorrelation based on both feature locations and feature values simultaneously. Given a set of features and an associated attribute, it evaluates whether the pattern expressed is clustered, dispersed, or random. The tool calculates the Moran's I Index value and both a z-score and p-value to evaluate the significance of that Index. P-values are numerical approximations of the area under the curve for a known distribution, limited by the test statistic. If the Mornas index is positive, the Z score is higher in number and the P value near to Zero there are hotspots areas .
After spatial autocorrelation using collect event tool from spatial analysis toolbox combines coincident points and it creates a new output feature class containing all the unique locations found in the integrated displacement point locations. It then adds a field named ICOUNT to hold the sum of all displacements at each unique location. The next step was conducting Optimized Hot Spot Analysis (Spatial Statistics) using collected displacement location points has created a map of statistically significant hot and cold spots using the Getis-Ord Gi* statistic. It evaluates the characteristics of the displacement location points to produce optimal results. At the end the IDW operation has executed to interpolates a raster surface from optimized hotspot displacement points.
The Morgan’s I static for spatial autocorrelation is given as Eq. (2):
I=nsoi=1nj=1nwi,wj zizji=1n*zi2(2)
Where zi is the deviation of an attribute for feature i from its mean (XI-X̅) wi,j is the spatial weight between feature i and j, n is equal to the total number of features, and So is the aggregate of all the spatial weights: Eq. (3):
SO = i=1nj=1nwi,j(3)
The zi score for statistic is computed as Eq. (4):
z=I-E[I]V[I](4)
Where: Eq. (5) and Eq. (6): shows the following value
EI=-1(n-1)(5)
VI=EI2-E[I]2(6)
4. Result and Discussion
In this part of the study, the author has discussed the causes of displacement, displacement situations, hot spot areas of displacement, and way of living situation after displacement and movements of IDPs in East Harerge Zone in spatial context. Thus, the raw data collected through different data collection instruments from various sources was presented and analyzed to answer the research objectives which are stated in the inception of the research study. The valuable data was collected using both primary and secondary data. The main raw data for this study is secondary data sources and strengthens the secondary data such as key informant interview data from DRMO and Humanitarian organization that are working on the IDPs. The secondary data sources are recorded IDP datasets from 2017 – 2022 by the DRMO and IOM DTM assessment reports.
4.1. Cause of Displacement
In the East Harerge Zone of Oromia region internal displacements occurred because of different factors in the last few years. According to the East Harerge zone head of DRMO office the main cause of displacement was conflict between Oromo and Somali ethnic groups. The other causes of displacement were natural induced displacements like seasonal flood and drought in different Woredas of the Zone. According to the Zone DRMO and IOM DTM data from 2017 up to 2022 around 537,199 individuals has been displaced from East Harerge Zone and on the other side around 538,191individuals has been displaced from East Harerge to different locations by the cause of conflict, drought and flood induced factors.
According to , the reasons and geographic distributions of internal displacement in the East Harerge Zone are given by the review of internal displacement in the region. It focuses on two main areas: the socioeconomic and psychological repercussions, as well as the main drivers of internal displacement. The main causes of internal displacement in the East Harerge Zone are the subject of this review. Examining the impact of conflict, drought, seasonal flooding, and other circumstances that lead people to flee their homes and communities is part of this. The information provided in the sources is consistent with other analyses of the causes and effects of internal displacement in Ethiopia, emphasizing the important roles that development, climatic conditions, and conflict-related factors play in the nation's humanitarian catastrophe.
4.1.1. Conflict Induced Displacement
East Harerge IDPs were displaced to different locations because of conflict. According to East Harerge DRMO key informants the main cause of displacement was ethnic and border conflict between Somali and Oromia regions. The most affected Woredas of this type of displacement were Chinakesen, Gursum, Babile Oromia, Kombolcha, Jarso, Midega Tola Meyu Muluke. Zone DRMO focal person stated that, there are still tensions and conflict-based displacements in Chinaksen Woreda. As you have seen on the (Figure 3) most conflict born displacements were occurred at border areas of the Zone with Somali region. The key informants stated that after conflict induced displacements properties of the displaced communities were damaged and service sectors have been destroyed. In addition to the key informant response according to a report compiled by multi-agency Belg 2019 assessment team of East and West Harerge zones conflict induced displacement has become the major emergency in East Harerge.
The socioeconomic and psychological impacts of internal displacement on people and communities within the East Harerge Zone are another important topic covered in the review. Claim that internal displacement led to the breakdown of social relationships, had a negative economic effect on the host communities as well as the IDPs, caused homelessness, increased the IDPs' vulnerability to psychological violence, and ultimately resulted in their death in the article .
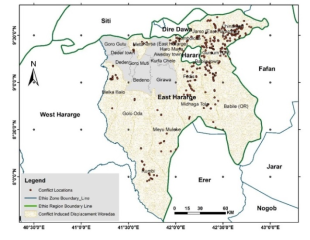
Figure 3. Conflict induced map (Source: ESSGI, DTM, ESRI, DRMO, 2023).
This entails being aware of the difficulties internally displaced people (IDPs) encounter in obtaining essential services, supporting themselves, maintaining their mental health, and generally being well. On this report according to the zonal officials and witnessed by the displaced community, the very nature of the conflicts they used to have over resources started changing since 2015 to an armed conflict across the borders resulting in losses of life, mass displacement and destruction of properties and infrastructures. The very nature was also escalated to urban cities where ethnic Oromos were expelled out of urban cities of Somali region and Somali land at the beginning of September 2017. These IDPs were expelled forcefully with exertion of physical attacks which resulted in serious trauma cases. They were made to flee empty handed, deprived of their assets which they owned during their stay in the region. The majority of the IDPs who registered large capital loss stayed more than 20 to 40 years in the region and some are even born and raised in the region. During the displacement time IDPs moved to their families, nearest Woredas, and government arranged locations like camp and camp like settings. The key informants and reports indicated that conflict affected location service sectors has been fully and partially damaged like health center and posts, schools, water points, and different government offices.
4.1.2. Flood Induced Displacement
East Harerge zone DRMO reported that historically eight Woredas of the zone namely, Deder, Girawa, Bedeno, Metta, Goro Muti, Goro Gutu, Melka Bello and Jarso are flood prone Woredas with reported history of minimal impacts. According to the East Harerge zone DRMO report, floods are common to the zone. The Flood induced displacements happened in different parts of the zone by different frequency (Figure 4). According to the national DRMC office, in the past 10 years high frequency seasonal based floods have occurred within the zone.
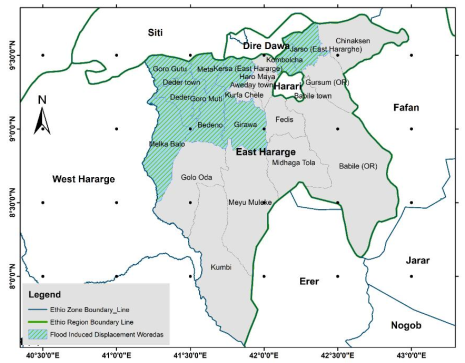
Figure 4. Flood induced displacement Woreda map (Source: ESSGI, DTM, ESRI, DRMO, 2023).
Based on the Zone DRMO focal person torrential rains and flooding, snowfall, hailstorms, water logging used to affect an increasing number of people leading to displacements, human deaths and damages to agricultural crops, vegetables, houses, and household property infrastructure damages to WASH schemes, schools, health facilities roads and bridges. For example, the assessment report as of August 20, 2020, indicated that 290,185 people (58,073HHs) were affected due to the flood and landslide in Goro Muti, Kersa Melka Belo, Bedeno, Meta, Deder, Kumbi, Giraw, Kombolcha, Jarso and Goro Gutu woredas. 970 houses were damaged out of which 330 were in total damaged resulting in the displacement of 1,090 people. Moreover, 22,080 hectares of Meher plantations were damaged impacting 18.885 people in 4 districts and landslides on 2061 hectares affected 18785 people. A total of 18 human deaths as well as 135 livestock deaths were reported.
In a similar vein , this study examined the reasons behind displacement and where they occurred between 2017 and 2022 utilizing data from several sources of war, drought, and flood-induced displacements, along with a spatial distribution analysis. The results demonstrated that the Somali and Oromia regions' borders were the sites of conflict-related displacement. Conversely, most of the time, flood-caused displacements originated from the area's steep sides, according to the spatial analysis. The study's other result is the locations of drought-caused displacement events, which are displayed in a clear spatial context. Conversely, this study provides a clear analysis of the trend of displacement and their movements. The IDPs who were relocated due to the cause of displacement and who came from and went to woredas have been examined in a spatial context.
Measuring dynamic population sizes and densities is considerably more challenging than estimating average population numbers and dispersion at high geographic resolution. Using remote sensing and GIS, population estimation could be carried out by extracting picture objects and categorizing various habitation types (such as tents, huts, etc.) based on spectral, geometrical, and attribute data. To have an updated map that will aid in the planning of the area or extents of space required for the IDPs to allot comfortable spaces for individuals, this may be modeled.
According to the key informant interview from Zone and Woreda DRMO experts, most of the time after heavy rains received particularly during the rainy season of the area which has resulted in flash floods running down the hilly sides of the Harerge mountains washing away crop fields and plantations. The key informants stated that the flood also entered people’s houses and damaged household properties and resulted in loss of life both to human and livestock in the past occurrence of flood. The respondents said that in this zone most of the time rains are heavy and recurrently occurs for several days and for long hours in a day. In general, in this zone according to the informants, landslides and cracking, flooding, water logging and hailstorm were widely reported. The result of the interview shows that flooding and landslides caused severe damage to planted long cycle crops, cash crops like chat and coffee, vegetables and fruits, livestock, infrastructures, and houses.
4.1.3. Drought Induced Displacement
According to the East Harerge DRMO focal person the drought induced displacements were common in the past 5 years. The characteristics of this displacement were people that moved to better locations with their livestock until the weather came to good conditions.
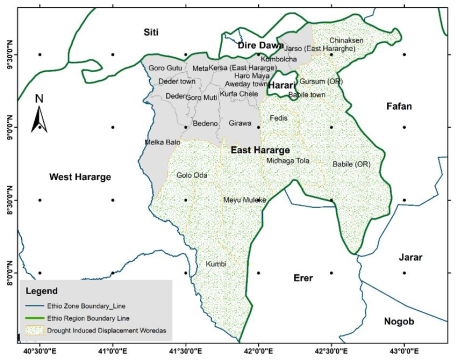
Figure 5. Drought induced displacement Woreda map (Source: ESSGI, DTM, ESRI, DRMO, 2023).
Based on (Figure 5) the most common Woredas drought induced displacements are Fedis, Midega Tola, Babile, Chinaksen, Meyu Muluke, Kumbi and Gursum. According to the key informant interviewers East Harerge Zone dry Woredas are recurrently affected by drought with its major impacts on food security and livelihood of the community, water for both human and livestock and pasture for livestock. During the drought years, competition over resources has been very common among communities within the zone and across the border with Somali region.
4.2. Spatial Trends and Statistics of Displacement
The use of GIS for disaster management can ultimately be seen as a means for developing spatial thinking skills. Spatial thinking is the idea of using the properties of space (distance, direction), visual representations (maps, diagrams), and reasoning processes to structure and solve problems . Spatial thinking can indeed be effectively promoted, albeit implicitly, among local government officials through the integration of spatial considerations within disaster risk management planning .
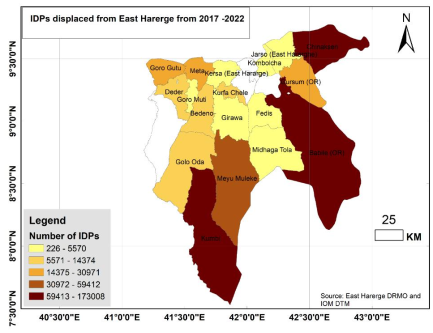
Figure 6. IDP statistics map from East Harerge to different locations (Source: ESSGI, DTM, ESRI, DRMO, 2023).
Based on this review the researcher tried to show spatial based analysis of internally displaced people in the study area. Using the dataset that collected from IOM DTM data the trends internal displacement from East Harerge showed that, high number of displacements was occurred during 2017 by the cause of conflict between Somali and Oromo ethnic groups.
The other causes of displacement were drought and flood within the zone. (Figure 6) shows that based on the data source the highest displacement was at the border of Woredas of the Zone to another region and to border Woredas of East Harerge Zone. During this displacement the major cause were conflicts between Somali and Oromo ethnic groups. Due to that factors Somali ethnic groups were displaced to their regions and the border Woreda Oromo ethnic groups also by the fear of conflict move back to their neighbor Woreda’s until the condition came to good. See the (Table A4) those IDPs displaced from East Harerge Woredas to other locations per zone and Woreda. According to the data 97% of displacement in the last 6 years was conflict and the other 3% was drought (1.3%) and flood (1.7%) based on the DTM dataset.
On the other side IDPs came from different locations to East Harerge zone mainly by the cause of conflict. The displacement statics showed that the highest number of IDPs came from border areas of the Zone by the cause of both natural and human induced displacements. Spatially most IDPs came from Somali region and border areas of East Harerge Zone. As (Figure 7) show that the IDP statistics from 2017 up to 2022 in East Harere Woredas that came from different locations and settled in camp and camp like settings and host communities both in urban and rural areas.
According to the Zone and Woreda DRMO key informants currently most of the displaced IDPs are returned to their place of origin especially border Woreda displaced communities. On the other side there are IDPs still not returned to their displaced locations. Until now there are IDPs in East Harerge zone that displaced from different locations especially from Somali region to East Harege Woredas. Those non returned IDPs are living in the camp and camp like settings at different Woredas like Deder, Goro Gutu, Kersa, Meta and other locations. According to the zone woreda DRMO focal person the reason does not return to displaced location is because of fear and their resources are already damaged.
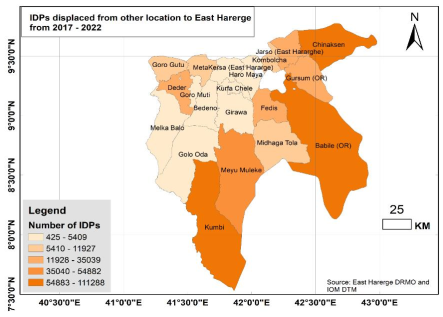
Figure 7. IDP statistics map from different location to East Harerge (Source: ESSGI, DTM, ESRI, DRMO, 2023).
4.2.1. Spatial Displacement Patterns
Using GIS for disaster management might be considered to hone spatial thinking abilities. The concept of spatial thinking is the application of logical processes, visual aids like maps and diagrams, and spatial characteristics like direction and distance to organize and resolve issues . By incorporating spatial concerns into disaster risk management planning, local government officials can be effectively encouraged to think spatially, even if implicitly. The researcher attempted to demonstrate a spatially based analysis of internally displaced people in the study area based on this review.
4.2.2. Destination to IDPs
Based on the first case IDPs were displaced from East Harerge to different locations (Table A3). The result shows that most of IDPs from this zone displaced to border Woredas of the Zone, Somail region different Woredas and Dire Dawa city. (Figure 8) shows that the destination of IDPs from East Harerge to different Zones of the regions.
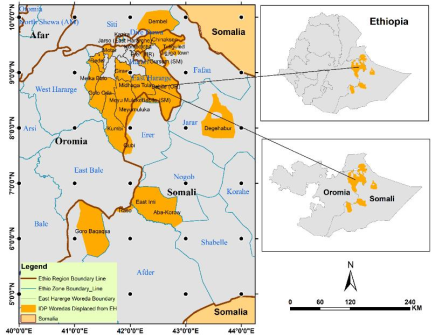
Figure 8. Map of IDP Displaced Woredas from East Harerge (Source: ESSGI, DTM, ESRI, DRMO, 2023).
4.2.3. Origins to IDPs
On this case the researcher analyzed the IDPs were displaced from different locations to East Harerge (Table A4). The results show that most of IDPs to this zone came from border Woredas of the East Harerge and Somail region different Woredas. (Figure 9) shows that the displacement origin woredas from different locations to East Harerge Zone.
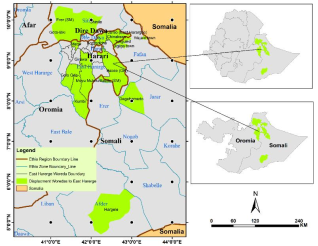
Figure 9. Map of IDP Displaced Woredas from other location to East Harerge (Source: ESSGI, DTM, ESRI, DRMO, 2023).
The result showed that 57% of IDPs came from Fafn Zone of Somali region, 40 came from East Harerge border woredas by fear of conflict, 2% from Siti zone of Somali region, 1% from Jarar zone of Somali region and the remain came from Afder zone of Somali region. Most IDPs were came from Somali regions of Fafan, Afder, siti and Jraar zones.
As per the key informants most Oromo IDPs were work different business at Somali regions of urban areas (Figure 9). The second largest groups of IDPs were came from from border areas of the study areas by fear of conflict. Acording to the Zone and Woreda DRMO office, IOM, UNHCR and CRS key informants almost all displaced IDPs were returened back to their place of Origin.
4.2.4. Hotspot Areas of Displacements
The result of this study shows that there are different locations of hotspot areas of displacements that are caused by natural and human induced factors. To show these displacement situations in a better descriptive way of hotspot and cold spot locations, the writer conducted Kernel Density and Optimized Hot Spot Analysis. Depending on Kernel Density analysis tool (Figure 10) Chinaksen, Babile Oromia, Kumbi, Goro Gutu and Meta Woredas are highly displaced locations of the Zone from 2017 up to 2022.
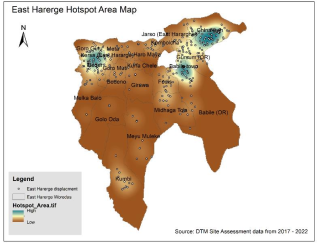
Figure 10. Internal displacement hotspot area map (Source: ESSGI, DTM, ESRI, DRMO, 2023).
The Kernel density showed that the magnitude-per-unit area from displacement point data kernel function fits a smoothly tapered surface to each location. Similar study conducted in Nigeria states that, the National Commission for Refugees, Migrants and IDP (NCRMID) recorded no fewer than 613,729 displaced living in various IDP camps across the country from January 2013 to February 2014. Their displacement was caused by various conflicts and natural disasters witnessed in recent times. However, it is believed that this number has increased by at least 100% due to the spike in violent attacks, kidnappings, and killings in the northern regions of Nigeria (Borno, Yobe, Gombe, Plateu, Kano, Kaduna, and Niger).
On the other side using optimal hotspot analysis tool the researcher identified the hotspot and cold spot areas of the zone.
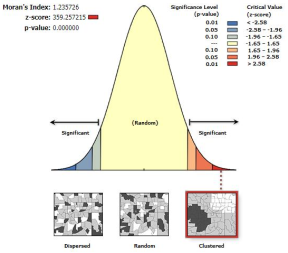
Figure 11. Spatial Autocorrelation of displacement situation in East Harerge from 2017 -2022 (Source: ESSGI, DTM, ESRI, DRMO, 2023).
The spatial autocorrelation result showed in (Figure 11) there is high displacement hotspot areas within the study areas. The displacement situation of East Harerge zone mornas index is 1.235726, the Z score is 359.257215 and the P-value is 0 and this indicated that there are hotspot areas of displacement within the zone. Based on the result optimized hotspot analysis of this study, there were highly hotspot Woredas like Chinakesen, Babile Oromia, Gursum, Goro Gutu, Kumbi, Meyu Muluke and Deder (Figure 12).
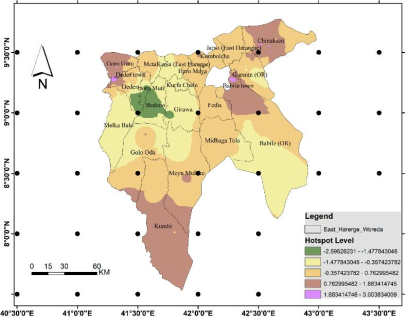
Figure 12. Optimized Hotspot Areas (Source: ESSGI, DTM, ESRI, DRMO, 2023).
4.2.5. Current IDP Site in East Harerge
Currently there are IDP sites within different Woredas of East Harerge Zone. According to the last DTM site assessment report in September 2022 a total of 184 IDP sites are assessed and for further detail see (Table A1) Total Number IDPs in the Active site.
Figure 13. East Harerge current active IDP site number of IDPs (Source: ESSGI, DTM, ESRI, DRMO, 2023).
These IDPs are currently living in the form of collective center, dispersed settlement, host communities/families, planned camp and spontaneous camp . (Table 1) shows the current active IDP sites total number of IDPs within the listed IDP site types in the zone. According to the key informants and humanitarian workers the collective site IDPs sites are government offices, government hall, TVET colleges, and other service provision places (Figure 13).
Table 1. Type of IDP sites and number individuals (Source DTM dataset 2017-2022).

Types of IDP site

Current total number of IDP individuals

number of sites

Collective center

5569

12

Dispersed settlement

28026

3

Host community/families

80732

156

Planned camp/site

2553

4

Spontaneous camp/site

19624

9

Grand Total

136504

184

Table 2. Types of IDP sites in rural and urban areas (Source: DTM dataset 2017-2022).

Types of sites

In Rural

In Urban

Grand Total

Collective center

1

11

12

Dispersed settlement

3

3

Host community/families

131

25

156

Planned camp/site

4

4

Spontaneous camp/site

9

9

Grand Total

144

40

184

Due to that factor those places are not providing services for the community. Based on the round 31 site assessment reports of DTM dataset a total of 40 IDP sites existed in urban areas of the Zone and the remaining 144 IDP sites existed in rural areas of the zone.
5. Conclusions
The purpose of the study is to analyze the internal displacement of the East Harerge Zone using GIS techniques. To be precise, it has aimed to analyze the cause of the displacement, hotspot areas of displacement, trends of displacements in spatial context in East Harerge Zone. The results have shown that GIS techniques can effectively analyze internal displacements. DTM Displacement dataset with integrating GIS data like admin boundaries East Harerge displacement situation has been analyzed . The result showed that major causes of displacement in the study area were conflict, drought, and flash flood. Based on the result conflict induced displacement was high in number during 2017 between Oromo and Somali ethnic groups. Conflict induced displacements are still tensions in Chinaksen Woredas of East Harerge. Geographic Information System (GIS) techniques clearly showed the conflict-based displacements within the Zone.
In East Harerge zone historically there are eight Woredas frequently affected by flood namely, Deder, Girawa, Bedeno, Metta, Goro Muti, Goro Gutu, Melka Bello and Jarso. On this study using GIS techniques those Woredas affected by flood has clearly visualized in map. In addition to that based on the key informants’ responses, landslides and cracking, flooding, water logging and hailstorm were the most common natural induced displacements, and these can lead for severe damage to planted long cycle crops, cash crops like chat and coffee, vegetables and fruits, livestock, infrastructures, and houses in East Harerge highland areas. The other causes displacement in East Harerge zone are drought. Using the NDRMC and Zonal DRMO collected drought data and with integrating GIS techniques the map of drought affected Woredas presented. The most common drought induced displacement Woredas are Fedis, Midhega Tola, Babile, Chinaksen and Gursum. According to the Zone DRMO focal person, the characteristics of drought caused displacements are temporary. That means most of the time those displaced people moved with their livestock to better weather locations of neighbor Woredas.
On this study using displacement datasets and spatial based East Harerge admin boundaries Woreda level IDP statistics has been analyzed and visualized through maps. Using the GIS techniques both in and out IDP figures of East Harerge Woredas has been prepared separately. The result of these in and out IDP figure maps show the capability of GIS for better decision making during and after displacements with considering the number and spatial distribution. These two maps help for priority given with considering the most affected Woreda. On the other side, it clearly analyzed and mapped place of origin of IDPs by separating them into two cases. The first cases were where the IDPs displaced from East Harerge to different locations and spatially mapped. Based on this most IDPs displaced to Somali region of different zones and within East Harerge. The spatial trends of displacements showed that the highest displacement occurred during 2017 and after that the situations decreased. The second case was from where IDPs came to the study area in spatial context. On this study using GIS techniques spatially where IDPs were came to East Harerge showed in proper manner. Based on this the result shows the largest IDPs were camp from Somali region different zones and border areas of the study area.
The other result of this study is there are active IDP sites within East Harerge that were displaced from different location by the natural and human induced displacement causes. Currently a total of 184 IDP sites exist in this zone. This research can be further extended to several directions to overcome a few limitations of the study conducted herein. First, internal displacement in most concerned organization conducting without GIS technologies. Time is the crucial factor during an emergency phase. Rapid response strategies are highly desirable in any scenario where satellite imagery is utilized. These situations arise when there is a potential hazard, such as natural disasters or military conflicts, or when the place is too far to obtain any meaningful information from the ground. Population estimates for camps housing refugees and internally displaced people are crucial to the overall logistics of humanitarian relief groups. According to the East Harerge DRMO and Woreda officials are not using GIS for internal displacement situation. For internal displacement data management and analysis spatial based database system is very significant to easily manage trends, severity levels, frequency of displacements, movements IDPs and statistics of displacements in spatial context. The second thing managing or using GIS for displacement analysis helps to predict the high-tension location of displacement with integrating other related data like rainfall, temperature, and land surface temperature.
6. Recommendations
Based on the analysis results it has been recommended that the East Harerge DRMO office better to strengthen GIS technology utilization for further analysis. Some of the author recommendations are; All disaster risk management offices starting from National to Woreda level have better to strengthen spatial bases disaster management mechanism using GIS and remote sensing technologies; Academic instruction or Universities better to support to DRMO offices by providing trainings and conducting regular base research on internal displacement cause and consequences using Geospatial technologies; The East Harerge disaster risk management office on a regular base better to identify the hot spot areas of displacements in spatial context for better decision making; The National Disaster Risk Management office, when they prepare their policies better to give high consideration the significance of GIS technologies on disaster risk management activities; and The government should consider the durable solutions of displacement by integrating the humanitarian organizations and other stockholders.
Abbreviations

CRS

Catholic Relief Services

CSV

Comma Separated Values

DRMO

Disaster Risk Management Office

DTM

Displacement Tracking Matrix

GIS

GIS Geographic Information System

GPS

Global Positioning System

IDMC

International Disaster Monitoring Center

IDPs

Internally Displaced Persons

IOM

International Organization for Migration

MMR

Mixed-methods Research

NCRMID

National Commission for Refugees, Migrants and IDP

NDRMC

National Disaster Risk Management Commission

TVET

Technical and Vocational Education and Training

UNHCR

United Nations High Commissioner for Refugees

WASH

Water, Sanitation, and Hygiene

Acknowledgments
We express our gratitude to the Department of Geography and Environmental Studies at Dire Dawa University and Dilla University for their invaluable facilities and support throughout this study.
Author Contributions
Birhanu Kifle Obsea: Conceptualization, Formal Analysis, Methodology, Software, Writing – original draft
Matiwos Belayhun: Supervision, Writing – review & editing
Tsion Ayalew Kebede: Visualization, Writing – review & editing
Funding
This research did not receive any specific grant from funding agencies in the public, commercial, or not-for-profit sectors.
Data Availability Statement
The data featured in this study can be obtained upon request from the corresponding author (Birhanu). To protect privacy, the link to the drive where the data is stored is not publicly shared.
Conflicts of Interest
The authors declare no conflicts of interest.
Appendix
Table A1. Total Number IDPs in the Active site.

Woredas

Total Number of IDP Individuals

Total Number of Sites

Aweday town

533

1

Babile (OR)

4552

17

Babile town

761

1

Bedeno

528

2

Chinaksen

34392

37

Deder

2238

14

Deder town

4191

8

Fedis

13323

10

Girawa

624

4

Golo Oda

836

1

Goro Gutu

3080

9

Goro Muti

656

6

Gursum (OR)

10706

23

Haro Maya

1174

8

Jarso (East Hararghe)

7588

9

Kersa (East Hararge)

1716

5

Kombolcha

326

3

Kumbi

32585

4

Kurfa Chele

209

1

Melka Balo

1096

6

Meta

1497

6

Meyu Muleke

12529

2

Midhaga Tola

1364

7

Grand Total

136504

184

Table A2. East Harerge CSA Estimated Population.

Woreda

Male

Female

Total

Babile town

3878

4002

7881

Kombolcha

103526

101133

204659

Jarso (East Hararghe)

78695

77270

155965

Gursum (OR)

111858

109113

220971

Babile (OR)

13749

14191

27940

Fedis

81668

80132

161800

Haro Maya

129613

132130

261743

Kurfa Chele

43429

42630

86059

Kersa (East Hararge)

115844

114930

230774

Meta

183435

180504

363940

Goro Gutu

106338

102158

208496

Deder

144279

151067

295346

Melka Balo

130113

124998

255112

Bedeno

171884

169615

341499

Midhaga Tola

56202

53281

109483

Chinaksen

66842

63076

129918

Girawa

172712

168487

341199

Golo Oda

76963

73249

150213

Meyu Muleke

33819

33093

66912

Haromaya town

31723

30401

62124

Goro Muti

52285

52610

104895

Deder town

13956

12251

26206

Kumbi

15081

14816

29897

Aweday town

7970

7568

15538

Grand Total

1945863

1912705

3858569

Table A3. Zonal level internally displaced people from East Harerge to other locations (Source: DTM dataset 2017-2022).

IDPs destination Zone

IDPs destination Woreda

Total IDPs

Displaced Woreda

Afder

Raso

8203

Harar Town

Dire Dawa

Dire Dawa/Town

18260

Malka Balo

East Harerge

Babile

108675

Babile

Chinaksen

66184

Chinaksen

Deder

2982

Deder

Girawa

226

Girawa

Golo Oda

978

Golo Oda

Jarso (East Hararghe)

405

Jarso

Kombolcha

5119

Kombolcha

Kumbi

89831

Kumbi

Malka Balo

290

Golo Oda

Malka Balo

300

Meta

Meta

4336

Meta

Meyu Muluke

54558

Meyu Muluke

Midega Tola

1409

Meyu Muluke

Midega Tola

1133

Midega Tola

Erer

Mayamuluqo

7389

Golo Oda

Mayamuluqo

2695

Meyu Muluke

Meyumuluka

750

Meyu Muluke

Qubi

18070

Kumbi

Fafan

Babile

58579

Babile

Babile

2153

Fedis

Babile

5717

Golo Oda

Babile

4437

Midega Tola

Babile (SM)

250

Babile

Gursum

1264

Babile

Gursum

24987

Gursum

Jigjiga town

1080

Chinaksen

Jijiga

3251

Chinaksen

Tuliguled

35264

Chinaksen

Tuliguled

2160

Gursum

Hareri

Erer (HR)

235

Babile

Hareri

Erer Woldiya

1000

Babile

Jarar

Degehabur

294

Babile

Liban

Goro Baqaqsa

1220

Harar Town

Shabelle

Aba-Korow

389

Babile

East Imi

2322

Babile

Siti

Dembel

804

Chinaksen

Table A4. Zonal level internally displaced people from other location to East Harerge (Source: DTM and East Harerge DRMO.

Origins of displacement Zone

Origins of displacement woreda

Total IDPs

Destination Woreda

Afder

Hargele

190

Babile

East Harerge

Babile

22680

Babile

Chinaksen

33037

Chinaksen

Deder

5695

Deder

Girawa

226

Girawa

Golo Oda

290

Malka Balo

Jarso

405

Jarso (East Hararghe)

Kombolcha

5119

Kombolcha

Kumbi

89831

Kumbi

Meta

2845

Meta

Meyu Muluke

54345

Meyu Muluke

Meyu Muluke

1409

Midega Tola

Fafan

Babile

357

Babile

307

Girawa

Jigjiga City Administration

638

Jarso (East Hararghe)

78

Meta

81049

Babile

1859

Bedeno

59961

Chinaksen

29344

Deder

18498

Fedis

2593

Garo Muti

1666

Girawa

978

Golo Oda

5147

Goro Gutu

20798

Gursum

10631

Harar Town

5409

Haro Maya

23195

Jarso

4179

Kersa

1628

Kombolcha

425

Kurfa Chele

3593

Malka Balo

4222

Meta

537

Meyu Muluke

3597

Midega Tola

Togo-Wajale

7012

Babile

2144

Chinaksen

1066

Gursum

91

Kersa

Tuliguled

10209

Chinaksen

4113

Jarso

Jarar

Degehamedo

6718

Midega Tola

Siti

Erer

3202

Goro Gutu

Erer

807

Meta

Gota-Biki

2958

Goro Gutu

Shinile

620

Goro Gutu

Shinile

2490

Meta

References
[1] IDMC, “Global Report on Internal Displacement (GRID 2022),” 2022.
[2] A.: Wertz, S. Promoteur, and P.; Lejeune, “Development of a Gis based methodology to support decision making for displacement settings’ location in developing countries: Application to Niger.” [Online]. Available:
[3] T. A. Tesfaw, “Internal Displacement in Ethiopia: A Scoping Review of its Causes, Trends and Consequences Keywords Author’s Institutional Affiliation and Correspondence,” vol. 12, no. 1, pp. 2–31, 2022.
[4] IDMC, “Africa report on internal displacement.,” The Internal Displacement Monitoring Centre 3 rue de Varembé, 1202 Geneva, Switzerland, 2019.
[5] E. B. Yigzaw, G. S. & Abitew, “Causes and impacts of internal displacement in Ethiopia.,” African Journal of Social Work, vol. 9, pp. 32–41, 2019.
[6] Norwegian refugee council, “Internal displacement monitoring center,” 2022.
[7] “INTERNAL DISPLACEMENT IN ETHIOPIA SINCE 2016: CHALLENGES AND PROSPECTS OF LOCAL INTEGRATION IN SEKELA WOREDA, AMHARA REGION.,” 2020.
[8] T. A. Robin et al., “Using spatial analysis and GIS to improve planning and resource allocation in a rural district of Bangladesh,” BMJ Global Health, vol. 4, pp. 1–9, 2019,
[9] J. Haji, Y. Mengesha, D. Tamiru, G. Alemu, G. Birhane, and T. Chaka, “Aid effectiveness in the WASH sector in Oromia region, Eastern Hararghe zone: The case of Goro-Gutu and Babile wordeas,” no. September, 2010.
[10] D. Tolossa and T. Tafesse, “Linkages between Water Supply and Sanitation and Food Security A case study in four villages of East Hararghe zone, Oromia region,” 2008.
[11] “Damage to maize crops by flood in Deder woreda-photo credit the assessment team 1”.
[12] M. Sileshi, R. Kadigi, K. Mutabazi, and S. Sieber, “Analysis of households’ vulnerability to food insecurity and its influencing factors in East Hararghe, Ethiopia,” Journal of Economic Structures, vol. 8, no. 1, 2019,
[13] T. Zeleke, F. Beyene, T. Deressa, J. Yousuf, and T. Kebede, “Vulnerability of Smallholder Farmers to Climate Change-Induced Shocks in East Hararghe Zone, Ethiopia,” pp. 1–19, 2021.
[14] K. B. Berse, F. Bendimerad, and Y. Asami, “Beyond geo-spatial technologies: Promoting spatial thinking through local disaster risk management planning,” in Procedia - Social and Behavioral Sciences, Elsevier Ltd, 2011, pp. 73–82.
[15] S. Dawadi, S. Shrestha, and R. A. Giri, “Mixed-Methods Research: A Discussion on its Types, Challenges, and Criticisms,” Journal of Practical Studies in Education, vol. 2, no. 2, pp. 25–36, Feb. 2021,
[16] ESRI, “Spatial Analysis with ArcGIS Pro,” 2019.
[17] ESRI, “How Optimized Hot Spot Analysis works.”
[18] T. A. Tesfaw, “Internal Displacement in Ethiopia: A Scoping Review of its Causes, Trends and Consequences.” [Online]. Available:
[19] G. Sewenet and E. Belay, “CAUSES AND IMPACTS OF INTERNAL DISPLACEMENT IN ETHIOPIA,” 2019.
[20] A. M. Jimma, “Cause and consequences of internal displacement of Oromo persons from the Somali Regional State and coping strategies at the Laga Xaafo Laga Dadhi Resettlement Site,” 2020.
[21] OCHA, “East and West Hararghe zones Disaster Risk Management Offices Conflict-Induced IDPs Return, Relocation and Recovery Plan A report compiled by multi-Agency Belg 2019 Assessment Team of East and West Hararghe zones July 2019,” 2019.
[22] OCHA, “OCHA East Hub East Hararghe Zone of Oromia: Flash floods,” 2020.
[23] M. O. Okegbola and O. S. Tomiwa, “THE USE OF REMOTE SENSING AND GIS IN SITING AND ESTIMATION OF INTERNALLY DISPLACED PERSONS’ (IDPS’) CAMP: ISSUES, CHALLENGES AND CONSIDERATIONS UAV IMAGE MAPPING: AN APPLICATION IN MONITORING AND CONTROL OF CRIME AND INSECURITY Impact Factor: 3.799 Global Journal of Engineering Science and Research Management View project Environmental Geo Hazard and Analysis View project.” [Online]. Available:
[24] R. S. Bednarz and S. W. Bednarz, “The Importance of Spatial Thinking in an Uncertain World,” in GeoJournal Library, vol. 94, Springer Science and Business Media B. V., 2008, pp. 315–330.
[25] International Organization for Migration. IOM: National Displacement Report. Available from:
[26] Ethiopian Disaster Risk Management Commission: EDRMC: DRM Knowledge Based and Exchange Platform. Available from:
[27] GIM International: GIS data is indispensable for UN migration agency. Available from:
[28] Researching Internal Displacement. Available from:
Cite This Article
  • APA Style

    Obse, B. K., Kebede, T. A., Belayhun, M. (2024). Spatial Based Analysis of Internally Displaced People in The Case of East Harerge Zone, Oromia Region, Ethiopia. Journal of Health and Environmental Research, 10(4), 114-133. https://doi.org/10.11648/j.jher.20241004.14

    Copy | Download

    ACS Style

    Obse, B. K.; Kebede, T. A.; Belayhun, M. Spatial Based Analysis of Internally Displaced People in The Case of East Harerge Zone, Oromia Region, Ethiopia. J. Health Environ. Res. 2024, 10(4), 114-133. doi: 10.11648/j.jher.20241004.14

    Copy | Download

    AMA Style

    Obse BK, Kebede TA, Belayhun M. Spatial Based Analysis of Internally Displaced People in The Case of East Harerge Zone, Oromia Region, Ethiopia. J Health Environ Res. 2024;10(4):114-133. doi: 10.11648/j.jher.20241004.14

    Copy | Download

  • @article{10.11648/j.jher.20241004.14,
      author = {Birhanu Kifle Obse and Tsion Ayalew Kebede and Matiwos Belayhun},
      title = {Spatial Based Analysis of Internally Displaced People in The Case of East Harerge Zone, Oromia Region, Ethiopia
    },
      journal = {Journal of Health and Environmental Research},
      volume = {10},
      number = {4},
      pages = {114-133},
      doi = {10.11648/j.jher.20241004.14},
      url = {https://doi.org/10.11648/j.jher.20241004.14},
      eprint = {https://article.sciencepublishinggroup.com/pdf/10.11648.j.jher.20241004.14},
      abstract = {Internally displaced persons (IDPs) are individuals or groups forced to flee their homes due to human-induced or natural causes. This study aims to analyze IDPs in East Harerge Zone using Geographic Information System, focusing on spatial aspects of internal displacement. The research examines the causes, hotspot areas, spatial patterns, trends, and statistics of displacements in the Zone. A mixed research approach was employed to understand the contextual situation of IDPs, incorporating their own meanings, experiences, and challenges. Primary data sources included observations and key informant interviews with Zonal, Woreda Disaster Risk Management Office (DRMO) officials, and humanitarian workers in East Harerge. Secondary data sources comprised published and unpublished documents such as Displacement Tracking Matrix (DTM) datasets from 2017-2022, humanitarian reports, journals, books, administrative boundary data, and IDP population figures. The study reveals a high number of displacements in East Harerge Zone from 2017 to 2022, with IDPs originating from 15 out of 24 Woredas (63%) and displaced to various locations within the country, including Dire Dawa, Somali Region, and other regions. Conversely, IDPs were also displaced to East Harerge Zone from the Somali region, residing in 22 out of 24 Woredas (92%). The spatial distribution of displacement, causes, hotspot areas, and existing IDP sites were discussed in a spatial context using ArcGIS software. The causes of displacement were analyzed in conflict, drought, and flood-induced bases. Therefore, this study will be an input for All disaster risk management offices starting from National to Woreda level to make better decision and policy to strengthen spatial bases disaster management mechanism using GIS and remote sensing technologies.
    },
     year = {2024}
    }
    

    Copy | Download

  • TY  - JOUR
    T1  - Spatial Based Analysis of Internally Displaced People in The Case of East Harerge Zone, Oromia Region, Ethiopia
    
    AU  - Birhanu Kifle Obse
    AU  - Tsion Ayalew Kebede
    AU  - Matiwos Belayhun
    Y1  - 2024/11/28
    PY  - 2024
    N1  - https://doi.org/10.11648/j.jher.20241004.14
    DO  - 10.11648/j.jher.20241004.14
    T2  - Journal of Health and Environmental Research
    JF  - Journal of Health and Environmental Research
    JO  - Journal of Health and Environmental Research
    SP  - 114
    EP  - 133
    PB  - Science Publishing Group
    SN  - 2472-3592
    UR  - https://doi.org/10.11648/j.jher.20241004.14
    AB  - Internally displaced persons (IDPs) are individuals or groups forced to flee their homes due to human-induced or natural causes. This study aims to analyze IDPs in East Harerge Zone using Geographic Information System, focusing on spatial aspects of internal displacement. The research examines the causes, hotspot areas, spatial patterns, trends, and statistics of displacements in the Zone. A mixed research approach was employed to understand the contextual situation of IDPs, incorporating their own meanings, experiences, and challenges. Primary data sources included observations and key informant interviews with Zonal, Woreda Disaster Risk Management Office (DRMO) officials, and humanitarian workers in East Harerge. Secondary data sources comprised published and unpublished documents such as Displacement Tracking Matrix (DTM) datasets from 2017-2022, humanitarian reports, journals, books, administrative boundary data, and IDP population figures. The study reveals a high number of displacements in East Harerge Zone from 2017 to 2022, with IDPs originating from 15 out of 24 Woredas (63%) and displaced to various locations within the country, including Dire Dawa, Somali Region, and other regions. Conversely, IDPs were also displaced to East Harerge Zone from the Somali region, residing in 22 out of 24 Woredas (92%). The spatial distribution of displacement, causes, hotspot areas, and existing IDP sites were discussed in a spatial context using ArcGIS software. The causes of displacement were analyzed in conflict, drought, and flood-induced bases. Therefore, this study will be an input for All disaster risk management offices starting from National to Woreda level to make better decision and policy to strengthen spatial bases disaster management mechanism using GIS and remote sensing technologies.
    
    VL  - 10
    IS  - 4
    ER  - 

    Copy | Download

Author Information
  • Abstract
  • Keywords
  • Document Sections

    1. 1. Introduction
    2. 2. Material and Methods
    3. 3. Methodology
    4. 4. Result and Discussion
    5. 5. Conclusions
    6. 6. Recommendations
    Show Full Outline
  • Abbreviations
  • Acknowledgments
  • Author Contributions
  • Funding
  • Data Availability Statement
  • Conflicts of Interest
  • Appendix
  • References
  • Cite This Article
  • Author Information