Research Article | | Peer-Reviewed

Assessment of the Influence of Safety Training on the Technicians Safety Culture in the Pharmaceutical Manufacturing Industries in Kenya

Received: 3 November 2024     Accepted: 15 November 2024     Published: 16 December 2024
Views:       Downloads:
Abstract

Introduction: Technicians in pharmaceutical manufacturing industries work in a high risk occupational setting. They are routinely exposed to chemical hazards due to the nature of their work. In order for them to perform, safety is paramount. This research intended to assess the influence of safety culture of technicians in pharmaceutical manufacturing industries. Methods: In order to achieve the objective, descriptive survey research design was used. Purposive sampling was used to select ten pharmaceutical Manufacturing industries which formed the research sample. Data was collected through questionnaires. The collected data was subjected to quantitative and qualitative analysis by use of SPSS. The results showed that the safety maturity level of 85% of the PMI’s were continually improving safety maturity level and only 15% in the involving safety maturity level. This was based on an analysis of the safety culture in four key dimensions. The study also established that majority of the respondents at 75.4% had their first encounter with OSH training at work environment commonly referred to as On the Job Training and only 23.3% were trained during their academic/professional education. The findings show that the majority of the respondents; 89.0 % and 80.8% of the respondents had been trained on the requirements of OSH Act 2007 and Evacuation procedures respectively. Notably, the training area with the least awareness was Exposure Limits of hazardous chemicals and substances at 29.1% across all PMI’s. The p values for OSH Training and Safe work documentation are p<0.001 and 0.421 respectively, indicating that OSH training is a statistically significant predictor of safety Culture. Conclusion: The hypothesis, there is statistically significant influence of training on safety culture of technicians among pharmaceutical manufacturing industries in Kenya, was accepted. Therefore we can conclude that OSH training has a significant positive influence on safety culture in pharmaceutical manufacturing industries in Nairobi, Kenya. The study therefore recommends that there is need to incorporate an OSH competency in the professional training of potential employees in the PMI’s in Kenya. This will enhance awareness of hazards and shape attitudes towards safety, well in advance hence enhance the safety culture maturity levels. The government thought the Ministry Of Labour And Social protection should ensure frameworks are able to enforce the implementation of OSHA (2007) training requirements to fill the gap in the training topic on handling of hazardous chemicals for workers in the PMI’s.

Published in Journal of Health and Environmental Research (Volume 10, Issue 4)
DOI 10.11648/j.jher.20241004.15
Page(s) 134-148
Creative Commons

This is an Open Access article, distributed under the terms of the Creative Commons Attribution 4.0 International License (http://creativecommons.org/licenses/by/4.0/), which permits unrestricted use, distribution and reproduction in any medium or format, provided the original work is properly cited.

Copyright

Copyright © The Author(s), 2024. Published by Science Publishing Group

Keywords

Occupational Safety and Health, Training, Safety Culture, Pharmaceutical Manufacturing Industries

1. Introduction
1.1. Background Information
The pharmaceutical industry is an industry in which companies, government regulators and researchers focus on the “safety” of the products and their effects on end users and the environment. Unlike in the general population, there exists a nominally healthy workforce in these industries. Employees who do not have the illness a particular drug is designed to treat have the potential to be exposed. Their exposure may be to an uncontrolled ‘dose’ and duration giving rise to the potential for adverse health effects and, due to the varied routes of exposure, health effects rarely seen in treatment can be observed.
While epidemiological studies are few for morbidity and mortality in pharmaceutical workers, it is well documented that certain classes of pharmaceuticals can produce adverse health effects with both acute and chronic exposures . In a healthy worker, any effects of drugs, whether positive or negative, should be considered serious and should be prevented. On the other hand the manufacture of drugs has brought immense benefits to humankind, and at the same time it has had negative impacts on human health and safety. The unsound management of chemicals poses threats to human well-being and it undermines human health. Most chemicals used in pharmaceutical manufacturing industries contain heavy metals, persistent organic solvents and poly-chlorinated biphenyls present, these chemicals pose serious and irreversible impacts on the mental health .
The pharmaceutical industry consists of three segments namely the manufacturers, distributors and retailers. All these play a major role in supporting the country’s health sector, which is estimated to have about 4,557 health facilities countrywide. Kenya is currently the largest producer of pharmaceutical products in the Common Market for Eastern and Southern Africa (COMESA) region, supplying about 30% of the regions’ market. Kenya has 33 active pharmaceutical manufacturers, According to .
A wide range of stakeholder groups across the globe recognize the presence of chemicals in products as an issue of concern and that they need more information regarding chemicals in products. The underlying argument for this need is the recognition that products are vehicles through which chemicals travel through our societies. When these chemicals have hazardous properties they may cause harm in relation to product safety for the consumer/user, environmental protection with respect to impacts caused throughout the products life cycle, and occupational health and safety for people handling or using the product in their work, in production and distribution, at the point of sale and in the EoL management of products.
The technician’s close relationship with chemicals and their major contribution to processes of drug manufacture provide them with a profound insight into chemical problems as well as potential so lutions to cope with them. Realization of this potential is, however, contingent on availability of an efficient system of encouragement, support, non-punitive and blame-free culture that allows the technicians to contribute to safety improvement without any fear of unfair punishment. Most developed coun tries have realized that in addition to exploiting modern technology and advanced managerial systems, high safety and reliability achievement is contingent on im proving personnel safety behaviors through integrating safety attitudes to their values, beliefs and practices i.e. establishing a “culture of safety”
The safety culture of an institution is a reflection of the actions, attitudes, and behaviors of its members concerning safety. These members include the managers, supervisors, and employees in the industrial setting. The prevailing health and safety culture within an organization is a major influence on the health and safety related behavior of people at work. The development of a positive safety culture is important if high standards of health and safety are to be achieved and maintained. Serious chemical accidents, incidents or near miss within an organization are often thought to be the result of a weak or deficient safety culture
It is widely accepted that if hazards are to be effectively controlled in the workplace then there needs to be effective management processes in place. Many organizations have learnt that there are limits to what can be achieved simply by using a systems based approach to OSH; also the use of ‘safe systems of work’ and ‘safe operating rules and procedures’ are of little benefit if employees are not committed to their application. Increasingly, organizations are recognizing the significant part ‘human factors’ plays in the maintenance of high standards of OSH. Safety culture is multi-faceted and includes workers views of the importance their employer gives to OSH relative to quality or production output or how committed managers/supervisors are to OSH
Previous studies on influence of training on safety culture have shown that staff with more knowl edge and understanding of safety issues, are more cooperative in error reporting and alerting the upcoming events. An efficient strategy to enhance safe ty attitudes is to train staff at all organizational levels. Training programs, with the aim of improving safety culture, have positive influence on occupational safety and individuals’ safety behavior . Considering the important role of training on staff’s safety attitudes, this study aims at providing insight into the influence of training on technicians on safety culture in the pharmaceutical manufacturing industries.
1.2. Statement of the Research Problem
The prevailing health and safety culture within an organization has a major influence on the health and safety related behavior of people at work. Unsound management of chemicals poses threats to human well-being and it undermines human health . The technician’s close relationship with chemicals and their major contribution to processes of drug manufacture provide them with a profound insight into chemical problems as well as potential so lutions to cope with them. Previous studies in developed countries have shown that training on safety culture equips workers with more knowl edge and understanding of safety issues, and are more cooperative in error reporting and alerting on the upcoming events .
However, in Kenya occupational safety and health (OSH) problems are still prevalent in the other sectors despite the existence of relevant laws and regulations . The pharmaceutical manufacturing industry is a growing sector primarily focused on producing generic medications, particularly in categories like anti-infective’s. Most raw materials are imported from mainly India in the form of active primary ingredients . A culture of safety in the pharmaceutical industry in Kenya has not been well studied, in terms of how it impacts the safety behaviors of workers. On the other hand approved safety training providers may exist, but it has not been ascertained whether pharmaceutical manufacturing companies consistently implement and evaluate the impact of such training programs on their safety culture, especially in relation to the occupational health and safety of their workers. The Kenya policy on OSH clearly shows the need to strengthen the involvement of workers and their representatives in matters relating to occupational safety and health and the need to improve the safety culture at workplaces . This research aimed at assessing the extent to which safety training influences the safety culture in the pharmaceutical manufacturing industries in Nairobi Metropolitan, Kenya.
The growing number of the Kenyan population has among other industries caused development of the pharmaceutical industry. To cater for the increasing population the industry requires commensurate investment in the occupational safety and health of workers. According to the Kenyan constitution stipulates that safe working conditions should be provided /protected. However, in the recent past, trends have shown accidents & incidents increasing in pharmaceutical industries and the situation seem to be getting out of hand despite existence of OSHA 2007. This might be attributed to the low awareness and low knowledge on OSH. Research shows that safety culture maturity from developed countries has shown a relationship between training and the number of accidents. This study intended to establish the relationship between training, exposure and workplace compliance in OSH in pharmaceutical industries.
2. Materials and Methods
2.1. Study Design
The study adopted a descriptive survey research design. This method was appropriate for the study because it investigated the possible relationships among variables without manipulating them; design allowed for examination of effect of naturally occurring treatment after a treatment has occurred and yields useful information that clarifies the understanding about nature of phenomenon . The study was carried out in Nairobi Metropolitan. The County was chosen because of its high number of pharmaceutical manufacturing companies. The county also housed the Directorate of Safety and Health Service (DOSHS) headquarters. The target population was all the forty-four (44) pharmaceutical manufacturing industries in Nairobi County registered with Pharmacy and Poisons board facilities register, out of which 33 were active pharmaceutical manufacturers.
Figure 1. Study Area of Nairobi Metropolitan, Source: Kenya Google satellite Maps.
2.2. Sample Size Determination
Descriptive studies can be carried out by selecting a sample size of at least ten percent of the accessible population . Hence Purposive sampling was adopted to obtain 10 pharmaceutical industries.
Table 1. A Table showing the target population and the application of the proportionate random sampling.

No.

Approximate Number of Technical Workers

Sample Number of Technical Workers

PMI1

139

54

PMI2

126

42

PMI3

159

69

PMI4

108

36

PMI5

156

52

PMI6

34

19

PMI7

132

44

PMI8

51

17

PMI9

44

21

PMI10

150

0

1099

354

In order to get a good a representative sample, Bartlett, Kotrlik and Higgins (2001) was used to determine the sample size. The total population in the sampled institutions was established to be approximately 987 employees this was rounded off to the nearest figure of 1000 whose sample size is indicated as 399 at 95% confidence level. Proportionate random sampling was used to obtain 316 technicians and 38 technical supervisors as shown in the Table 2 below:
Table for determining sample size for continuous and categorical data.

Population Size

Sample size

Continous data (margin of error=0.03)

Categorical data (margin of error = 0.05

Alpha=.10 t=1.65

Alpha=.05 t=1.96

Alpha=.01 t=2.58

Alpha=.10 t=1.65

Alpha=.05 t=1.96

Alpha=.01 t=2.58

100

46

55

68

74

80

87

200

59

75

102

116

132

154

300

65

85

123

143

169

207

400

69

92

137

162

196

250

500

72

96

147

176

218

286

600

73

100

155

187

235

316

700

75

102

161

196

249

341

800

76

104

166

203

260

363

900

77

105

170

209

270

382

1000

79

106

173

213

278

399

1500

83

110

183

230

306

461

2000

83

112

189

239

323

499

4000

83

119

198

254

351

570

6000

83

119

209

259

362

598

8000

83

119

209

262

367

613

10,000

83

119

209

264

370

623

Source:
2.3. Research Instruments
Data was collected using two types of research instruments including questionnaires, and observation checklists. The instruments were based on own experience in pharmaceutical industry and documented information about OSH. Review of health and safety related documents and records acted as a source of research data. One set of semi-structured questionnaires were administered to technicians, health and safety representative and the supervisors. Questionnaires and checklists were used because they were more efficient, economical and practical besides allowing use of a large sample The questionnaires were expected to draw data on technicians’ training and safety culture in the pharmaceutical manufacturing industry.
2.4. Data Processing and Analysis
An introductory letter from the Jomo Kenyatta University of Agriculture and Technology Board of Postgraduate Studies was obtained. Emails were sent to the sampled pharmaceutical industries to inform them of their inclusion in the study and of the intended visit. In case of absent respondents, follow up call were made to the pharmaceutical industries. Questionnaires were delivered on a drop and pick basis to all pharmaceutical industries and were self-administered. Respondents and work place observation for safety culture performance indicators and determination of chemical exposure levels was done on the same visit. Objectives of the study were reviewed and data sorted according to the variables and objectives of the study. Data was analyzed using both descriptive and inferential statistics. Means, percentages, frequencies, standard deviations, Chi square, ANOVA and Pearson moment correlation were used to analyze data related to all objectives. All data was analyzed using Statistical Package for Social Sciences ().
3. Results
3.1. Bio-data Analysis
The study questionnaires were issued to the workers out of 379 questionnaires administered, 344 were dully filled and returned making a response rate of 91%. This involved 296 technicians, 30 supervisors and 18 health and safety representatives. which complies with the acceptable return rate and a response rate of above 70% is excellent and representative .
To determine the distribution the data was analyzed as shown in the bar chart in figure 2 which shows that most of the respondents 43.2% belong to the as quality control department, 20.3% to the in-process quality assurance function, 18.8% indicated production, 12.2% indicated stores and 5.5% indicated administration.
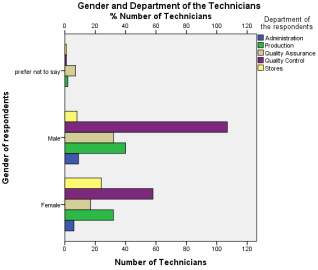
Figure 2. A Graph showing the distribution of the gender by the departments of the participating technicians.
Table showing the distribution of the Gender of the participating technicians.

Gender of respondents

Frequency

Percent

Valid Percent

Male

196

57

57

Female

137

39.8

39.8

Prefer not to say

11

3.2

3.2

Total

344

100

100

The findings indicate that majority of the respondents were female at 56.8%. 39.4% indicated that they were male while 3.8% preferred not to say. Further,. The highest numbers of the respondents at 48.7% were aged between 26 and 30 years and 38.6% were between 31-35 years. The lowest age categories with the lowest number of respondents were 18-25 years at 5.8%, 36-45 years at 5.2% and over 45 years at 1.7%. The finding of the study shows that most of the technicians working in the pharmaceutical manufacturing industries can be classified as youth by seeing that most of them at 93% are below 35 years.
The researcher also sought to establish the level of training of the technicians. The findings show that 51% of the technicians working in the pharmaceutical manufacturing industries were holders of a bachelor’s degree. The other respondents were diploma holders at 27.8%, certificate holders at 19.7% and only 1.4% being masters’ degree holders. The data was collated against the gender of the respondents which showed that most of the Degree & Diploma holders were male whereas most of the certificate Level holders were female.
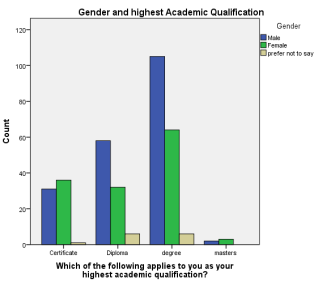
Figure 3. A graph showing Distribution of the gender and academic qualification of the participating technicians.
3.2. Analysis of the Levels of Technicians’ Safety Training In Pharmaceutical Manufacturing Industries
The research aimed at assessing the relationship between gender and the years of experience the findings on the years of experience show that most of the respondents (47.2%) had 2-4 years of working experience. 26.7% of the technicians had 5-7 years of experience, 14.2% of the technicians participating in the study had indicated 7-9 years 6.7% and 5.2% for less than 2 years, and above 10 years respectively
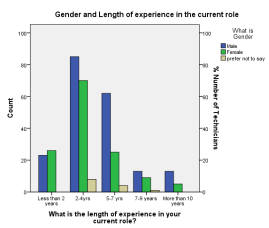
Figure 4. Distribution of the gender and length of experience in the current role of the participating technicians.
3.2.1. Technicians First Encounter with Training in OSH
To assess this, the research sought to find out the respondents’ first encounter with training in safety. The findings showed that majority 75.4% indicated On Job Training (OJT) and only 23.3% indicated Professional education as shown in figure 5 below.
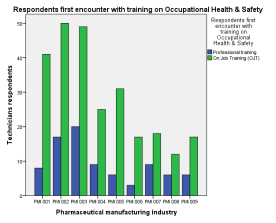
Figure 5. A comparative bar graph showing the technicians’ first encounter with training in OSH.
3.2.2. OSH Trainings that Had Been Conducted
The study sought to determine the whether all critical safety training areas were covered during the trainings according to requirements of the OSH Act 2007. The findings show the majority of the respondents; 89.0 % and 80.8% of the respondents had been trained on OSH Act 2007 and Evacuation procedures respectively. The training area with the least numbers was Exposure Limits to hazardous chemicals and substances at 29.1%. Other areas were covered as shown in table 4 shown below.
Table 4. A table showing a summary of the responses from the technician’s on the safety trainings attended across all PMI’s.

Safety Trainings prescribed by OSH Act 2007

Cumulative Percent

Yes

No

Are trained on the OSHA (2007)

89.0

11.0

Interpretation of MSDS-Material Safety Data Sheets

68.3

31.7

The handling, transportation and disposal of chemicals and other hazardous substance materials

78.2

21.8

Labelling and marking of hazardous chemicals and substances

77.9

22.1

Classification of hazardous chemicals and substances

63.7

36.3

Exposure limits to hazardous substances

29.1

70.9

Control of air pollution, noise and vibration

79.7

20.3

Evacuation procedures

80.8

19.2

General safety

66.9

33.1

3.3. An Analysis of the Safety Culture of the Technicians in Pharmaceutical Manufacturing Industries
3.3.1. Analysis of Individual Technicians Perceptions of Safety Before Employment
The study sought to determine the individual perception of safety of the respondents against other workplace related factors which included salary or compensation, Career advancement prospects, and working hours. They were asked to indicate the extent to which they considered aspects of the factors including their personal safety as they worked level of consideration prior to accepting a job offer. The results are shown in the table 5 below:
This is an indication that the technicians in the PMI’s ‘always’ consider their salary/compensation at 72.4%.
Table 5. An analysis of the responses of the technicians’ perception before employment.

Salary/Compensation

Frequency

Percent

Valid Percent

Cumulative Percent

Valid

Always

249

72.4

72.4

72.4

Sometimes

73

21.2

21.2

93.6

Never

22

6.4

6.4

100.0

Total

344

100.0

100.0

Working hours

Frequency

Percent

Valid Percent

Cumulative Percent

Valid

Always

159

46.2

46.2

46.2

Sometimes

172

50.0

50.0

96.2

Never

13

3.8

3.8

100.0

Total

344

100.0

100.0

Career advancement prospects

Frequency

Percent

Valid Percent

Cumulative Percent

Valid

Always

137

39.8

39.8

39.8

Sometimes

192

55.8

55.8

95.6

Never

15

4.4

4.4

100.0

Total

344

100.0

100.0

My personal safety

Frequency

Percent

Valid Percent

Cumulative Percent

Valid

Always

84

24.4

24.4

24.4

Sometimes

237

68.9

68.9

93.3

Never

23

6.7

6.7

100.0

Total

344

100.0

100.0

3.3.2. Analysis of Key Dimensions to Determine the Safety Maturity Levels in the PMI’s
Table 6. A Table Showing the Mean Scores and Standard Deviations of the Key Dimensions for Each Pharmaceutical Manufacturing Industry.

Mean scores and standard deviations from the sampled PMI’s

KD1

KD2

KD3

KD4

SAFETY CULTURE INDEX

PMI 001

Mean

2.8639

2.4592

3.585

3.2109

3.02975

Std. Deviation

0.49027

0.52872

0.62927

0.52128

0.542385

PMI 002

Mean

2.8209

2.5

3.7114

3.3234

3.088925

Std. Deviation

0.46176

0.46057

0.52831

0.47486

0.481375

PMI 003

Mean

2.8889

2.6014

3.686

3.2029

3.0948

Std. Deviation

0.38631

0.52566

0.57985

0.53081

0.505658

PMI 004

Mean

2.9314

2.6471

3.402

3.1176

3.024525

Std. Deviation

0.39166

0.33776

0.70486

0.61344

0.51193

PMI 005

Mean

2.9369

2.4865

3.5946

3.0991

3.029275

Std. Deviation

0.4363

0.49282

0.64853

0.46391

0.51039

PMI 006

Mean

2.8167

2.275

3.55

3.3

2.985425

Std. Deviation

0.38198

0.47226

0.65136

0.38843

0.473508

PMI 007

Mean

2.9753

2.5556

3.6914

3.2099

3.10805

Std. Deviation

0.40219

0.59377

0.44266

0.45431

0.473233

PMI 008

Mean

2.8333

2.5556

3.5185

3.2222

3.0324

Std. Deviation

0.30785

0.56592

0.5742

0.49836

0.486583

PMI 009

Mean

2.8551

2.3043

3.6232

3.2464

3.00725

Std. Deviation

0.37371

0.59809

0.40582

0.47373

0.462838

Total

Mean

2.8789

2.5087

3.6182

3.218

3.05595

Std. Deviation

0.41885

0.50931

0.58452

0.50197

0.503663

The PMI safety culture maturity level was measured using the mean scores of the employees’ level of satisfaction in the four key dimensions. Based on previous studies by Kao (2007), the level of satisfaction of the respondents was used to compute the level of the institutions safety maturity. The emerging level ranges from 0.00-0.99 average mean scores on satisfaction levels, managing from 1.00 – 1.99 mean scores on satisfaction levels, involving from 2.00-2.99 scores on satisfaction levels, cooperating from 3.00-3.99 mean scores on the level satisfaction and continually improving from 4.00 mean scores on the level of satisfaction. Low satisfaction score depicts low safety culture maturity level while high satisfaction score depicts high level of safety culture maturity. The satisfaction levels were computed from the Likert scale scores in each of the key dimensions where strongly agree (SA) and Agree (A) were summed up and mean scores calculated for each key dimension for all the PMI’s as indicated in Table 7.
Table for measuring and interpreting safety maturity levels from the mean scores of the key dimensions in safety culture The chi-square test of association to determine the Relationship between OSH training and technicians safety culture.

Mean scores On Likert Scale

Safety culture maturity

Implications

1.00 and below

Emerging

There is need for more management commitment

1.00 – 1.99

Involving

Realize the importance of ‘technical staff and develop personal responsibility

2.00-2.99

Cooperating

Engage all staff to develop cooperation and commitment to improving safety

3.00-3.99

Continually Improving

Develop consistency

4.00-and above

Mature

3.4. Analysis to Check the Between Training in OSH and the Technicians’ Safety Culture
The researcher sought to determine the relationship between training in OSH and the technicians’ safety culture in Nairobi County. The test was used to check the association between OSH training and the safety culture Key dimensions.
Table 8. Pearson Chi Test of Independence.

Chi-Square Tests

Value

Df

Asymp. Sig. (2-sided)

Exact Sig. (2-sided)

Exact Sig. (1-sided)

Point Probability

Pearson Chi-Square

1342.649a

30

.000

.000

Likelihood Ratio

835.826

30

.000

.000

Fisher's Exact Test

.000

.000

Linear-by-Linear Association

318.030b

1

.000

.000

.000

.000

N of Valid Cases

344

a. 26 cells (61.9%) have expected count less than 5. The minimum expected count is.02.

b. The standardized statistic is.000.

The output above shows that the Pearson Chi-Square test is statistically significant, with a p-value of 0.000. This indicates that there is a significant relationship between the variables of interest - safety training and safety culture. The high Chi-Square value of 1342.649 and the low p-value (p<0.001) suggest a strong association between the two variables, the Likelihood Ratio test and Fisher's Exact Test also show statistically significant results, providing additional evidence of the strong relationship between safety training and safety culture in this context whereby the Linear-by-Linear Association test, had a value of 318.030 and a p-value of (p<0.001).
3.5. Regression Analysis of The Influence of Training in OSH on the Safety Culture of The PMI’s
3.5.1. Multilinear Regression Model
The study sought to determine the influence of OSH training on safety culture. According to , Multiple regression analysis is used to determine whether a group of variables can predict a given dependent variable
The equation below was used to
Y = B0+ B1X1+ B2X2+ e
Where Y=the dependent variable; Safety Culture of PMI’S In Kenya
X1= the primary independent variable; OSH Training at PMI’s in Kenya
X1= the control independent variable; OSH documentation at PMI’s in Kenya
B0= is the Constant B1 & B2 = the regression coefficients or change induced in Y by each X whereas e =Error.
The F-test and t-test to check whether the estimated coefficients in the model is a good fit for the data obtained from the target population from which the sample has been drawn.
Table 9. A Table showing the Model Summary.

Model Summaryb

Model

R

R Square

Adjusted R Square

Std. Error of the Estimate

Change Statistics

Durbin-Watson

R Square Change

F Change

df1

df2

Sig. F Change

1

.963a

.927

.927

.03481

.927

2176.021

2

341

.000

1.842

a. Predictors: (Constant), SAFEWORKDOCUMENTATION, OSHTRAINING

b. Dependent Variable: SAFETYCULTURE

3.5.2. Anova and Statistical Significance
Table 10. Anova.

ANOVAa

Model

Sum of Squares

df

Mean Square

F

Sig.

1

Regression

5.273

2

2.636

2176.021

.000b

Residual

.413

341

.001

Total

5.686

343

a. Dependent Variable: SAFETYCULTURE

b. Predictors: (Constant), SAFEWORKDOCUMENTATION, OSHTRAINING

3.5.3. Model Coefficients
Table 11. A Table showing the Model Coefficients results.

Coefficientsa

Model

Unstandardized Coefficients

Standardized Coefficients

T

Sig.

Collinearity Statistics

B

Std. Error

Beta

Tolerance

VIF

1

(Constant)

.144

.020

7.022

.000

OSHTRAINING

.867

.013

.963

65.967

.000

1.000

1.000

SAFEWORKDOCUMENTATION

.006

.008

.012

.805

.421

1.000

1.000

a. Dependent Variable: SAFETYCULTURE

The results show that the Unstandardized Coefficients (B) is 0.867, safe documentation 0.006 units while the corresponding t-statistics for these coefficients are 65.967 and 0.805 respectively. The p values for OSH Training and Safe work documentation are 0.000 and 0.421 respectively, indicating that OSH training is a statistically significant predictor of safety Culture. The results show that specific training components like interpretation of MSDS, handling, transportation and disposal of chemicals and exposure limits to hazardous substances had the strongest positive influence on safety culture. This suggests that training that focuses on hazard identification, risk assessment and control measures is critical in shaping a strong safety culture within the industry. The researcher conducted further analysis of the influence of OSH training on the Safety culture:
Table 12. A table showing ANOVA Results from a multi-linear regression model showing the influence of safety training on safety culture

ANOVAa

Model

Sum of Squares

Df

Mean Square

F

Sig.

1

5.798

9

.644

3.957

.000b

54.378

334

.163

60.175

343

a. Dependent Variable: Safety Culture

b. Predictors: (Constant), General safety, Are trained on the OSHA (2007), Classification of hazardous chemicals and substances, Evacuation procedures, Exposure limits to hazardous substances, The handling, transportation and disposal of chemicals and other hazardous substance materials, Control of air pollution, noise and vibration, Labelling and marking of hazardous chemicals and substances, Interpretation of MSDS-Material Safety Data Sheets

Since the F-value is 3.957 and the p-value is 0.000, the regression model as a whole is statistically significant, suggesting that the independent variables significantly predict the dependent variable safety culture. This indicates that the set of predictors included in the model explains a meaningful portion of the variance in safety culture.
Table 13. A linear regression showing the relationship between specific safety training areas and Safety Culture.

Coefficientsa

Model

Unstandardized Coefficients

Standardized Coefficients

T

Sig.

95.0% Confidence Interval for B

B

Std. Error

Beta

Lower Bound

Upper Bound

1

(Constant)

2.651

.231

11.459

.000

2.196

3.106

Are trained on the OSHA (2007)

.071

.071

.054

.999

.318

-.069

.212

Interpretation of MSDS-Material Safety Data Sheets

.147

.050

.163

2.915

.004

.048

.246

The handling, transportation and disposal of chemicals and other hazardous substance materials

.209

.056

.206

3.714

.000

.098

.320

Labelling and marking of hazardous chemicals and substances

-.017

.055

-.017

-.317

.752

-.125

.090

Classification of hazardous chemicals and substances

-.065

.047

-.074

-1.380

.169

-.157

.027

Exposure limits to hazardous substances

.101

.049

.109

2.061

.040

.005

.196

Control of air pollution, noise and vibration

-.115

.055

-.110

-2.076

.039

-.223

-.006

Evacuation procedures

-.128

.057

-.121

-2.258

.025

-.240

-.017

General safety

-.053

.047

-.060

-1.126

.261

-.147

.040

a. Dependent Variable: Safety Culture

A linear regression was conducted to assess the relationship between several training aspects and the dependent variable (Safety Culture). Significant positive predictors of Safety Culture included the interpretation of MSDS materials (B =.147, p =.004) and the handling, transportation, and disposal of hazardous chemicals (B =.209, p =.000). Additionally, knowledge of exposure limits to hazardous substances was also positively associated with Safety Culture (B =.101, p =.040). On the other hand, control of air pollution, noise, and vibration (B = -.115, p =.039), and evacuation procedures (B = -.128, p =.025) were negatively associated with safety. Several predictors, including training on OSHA (2007) and general safety, were not statistically significant.
4. Discussion
Safety culture has been defined as the product of individual and group values attitudes, perceptions competencies and patterns of behavior that determine the commitment to and the style of proficiency of an organization health and safety management .
It is vital to factor in the gender differences in the design of occupational safety and health (OSH) procedures and strategies on hazard control. The argument put forward indicates that it is critical to acknowledge that there exist differences between the two genders which if ignored could pose challenges in the implementation of effective OSH management systems in any workplace .
The risk to physical hazards is significantly higher among younger workers than among older workers in any organization. Recommendations put forward to address this include trainings on safety for young workers to increase their knowledge and compliance . The results from the study confirmed that most of the respondents were young.
The results show that the majority of technicians working in the PMI’S in Nairobi County acquire their first training in safety through OJT. These findings agree with who established that a large proportion of employees are trained on occupational safety during employment.
Nonetheless, In order for students to learn safety the recommendation given was to consider preparation and continuing education programs that incorporate more production-based experiences focused on safety . The low training on exposure limits of the chemicals, poses risk to the technicians in the PMI’s exposing them chronic occupational diseases.
The researcher sought to determine the individual perceptions of the technicians when selecting a work environment the results indicated that the aspect of least priority was personal safety where only 24.4%. This indicates that there is need for awareness creation among job seekers in this industry considering the occupational chemical exposures in their routine schedules while at work.
Eight out of the nine PMIs in the study are on the borderline of the continually improving safety culture maturity level; one PMI is in the cooperating safety maturity level. This implies that there is need for sustained engagement of all staff to develop cooperation and commitment to improving safety in the pharmaceutical manufacturing industry, The safety culture maturity model
To determine whether there exists a significant linear trend in the data Pearson Chi Test was carried out and the results showed that, there was positive relationship between the two variables. This shows that safety training has a significant and positive influence on safety culture within the pharmaceutical manufacturing industry in Nairobi, Kenya.
This study's findings suggest that safety training is a key factor in shaping the safety culture within pharmaceutical manufacturing industries in the Nairobi metropolitan area.
OSH Documentation was used as a control variable and the analysis showed it did not have a statistically significant relationship with safety culture. The results show that specific training components like interpretation of MSDS, handling, transportation and disposal of chemicals and exposure limits to hazardous substances had the strongest positive influence on safety culture.
This suggests that training that focuses on hazard identification, risk assessment and control measures is critical in shaping a strong safety culture within the industry.
5. Conclusions
The findings of this study show that majority of the technicians encounter their first training on their jobs and that most of the technicians in the PMI’s are new labour market entrants
In addition There is a gap in the training on non-routine tasks such as preparation of hazardous chemicals cultures and reagents, handling spills of hazardous chemicals and dispensing hazardous chemicals. the study revealed a gap in the training on non-routine tasks such as preparation of hazardous chemicals, cultures and reagents, handling spills of hazardous chemicals and dispensing hazardous chemicals. Generally, there was a low awareness level on the exposure limits to hazardous chemicals and substances.
The study sought to determines the safety culture levels in the PMI’s, The study concludes that there is a neutral Emphasis on Safety in the PMI’s, the mean score indicates that technicians are non-committal about prioritizing safety equally to task completion. There is a subtle preference of task over safety the lower mean scores for PPE availability and safety procedures suggest that completing the job may take precedence over ensuring proper safety protocols are followed. General, PMIs in are on the borderline of the continually improving safety culture maturity level or transitioning to the cooperating safety culture maturity level.
In determining the influence of safety training on safety culture the study concludes that most of the technicians are not confident of their safety when handling hazardous chemicals and substances. This indicates that there is a significant relationship between the variables of interest - safety training and safety culture.
The study therefore recommends Therefore there is need to incorporate a OSH competency in the professional training potential employees in the PMI’s, this will enhance awareness of hazards and shape attitudes towards safety, well in advance hence enhance the safety culture maturity levels.
In addition, the government should ensure frameworks are able to enforce the implementation of OSHA (2007) training requirements to fill the gap in the training topic on handling of hazardous chemicals for workers in the PMI’s.
The quantitative analysis revealed a statistically significant and positive relationship between the extent of safety training received by workers and their perceptions of the organization's commitment to safety, trust in management, and overall safety culture.
The qualitative data further highlighted the importance of ensuring that safety training content is relevant and applicable to the specific safety risks and challenges faced by workers in this industry. To enhance safety culture, organizations should not only provide comprehensive safety training, but also regularly evaluate the effectiveness of such training and make necessary adjustments to address any gaps or weaknesses.
Therefore we can conclude that OSH training has a significant positive influence on safety culture in pharmaceutical manufacturing industries in Nairobi Metropolitan, Kenya.
Abbreviations

ACS

American Chemical Society

ANOVA

Analysis of Variance

COMESA

Common Market for Eastern and Southern Africa

DOSH

Directorate Occupational Safety and Health

DOSHS

Directorate of Occupational Safety And Health Services

KPPB

Kenya Pharmacy and Poisons Board

OSH

Occupational Safety and Health

OSHA

Occupational Safety Health Act

OSHO

Occupational Safety and Health Officers

PMI

Pharmaceutical Manufacturing Industries

PPE Personal Protective Equipment

SCMM

Safety Culture Maturity Model

SPSS

Statistical Package for the Social Sciences

UNEP

United Nations Environment Programme

MSDS

Material Safety Data Sheets

Acknowledgments
Christian Mshila while at Sphinx Pharmaceuticals and Regal Pharmaceuticals Dr. Sani -Lab & Allied for valuable insight into the Pharmaceutical Manufacturing industry.
Author Contributions
Josephine Miring’u: Conceptualization, Resources, data collection & analysis
Erastus Gatebe: Supervision
Benson Karanja: Supervision
Appendix
Appendix should be placed at the end of the paper, numbered in Arabic numerals, and cited in the text. If the Appendix includes one or more figures, please continue the consecutive numbering from the main text.
Data Availability Statement
The data supporting the outcome of this research work has been reported in this manuscript.
Conflicts of Interest
The authors declare no conflicts of interest.
References
[1] Heron, R., & Pickering, F. (2003, September 1). Health effects of exposure to active pharmaceutical ingredients (APIs). Oxford University Press, 53(6), 357-362.
[2] United Nations Environment Programme. (2006). Africa Environment Outlook 2: Our Environment, Our Wealth. United Nations Environment Programme (UNEP).
[3] International Finance Corporation. (2020). Kenya Pharmaceutical Industry Diagnostic Report 2020. International Finance Corporation (IFC).
[4] Leila Azimi, Seyed Jamaledin Tabibi, Mohammad Reza Maleki, Amir Ashkan Nasiripour, Mahmood Mahmoodi. (2012) Influence of Training on Patient Safety Culture: a Nurse Attitude Improvement Perspective. International Journal of Hospital Research, 1(1): 57-62.
[5] American Chemical Society (2012). Creating Safety Cultures in Academic Institutions: A Report of the Safety Culture Task Force of the ACS Committee on Chemical Safety. Bronx: ACS.
[6] Hay, D. (2010). Safety Culture Assessment Tool: An overview. Wellington: WorkPlace Press.
[7] Tait, F N., Mburu, C., & Gikunju, J K. (2018, January 1). Occupational safety and health status of medical laboratories in Kajiado County, Kenya. African Field Epidemiology Network, 29.
[8] Kurunthachalam, S. K. (2012, January 1). Pharmaceutical Substances in India are a Point of Great Concern? OMICS Publishing Group, 3(5).
[9] Ministry of Labour. (2012, May). The National Occupational Safety and Health Policy.
[10] Cohen, L., Manion, L. and Morrison, K. (2000) Research Methods in Education. 5th Edition, Routledge Falmer, London.
[11] Mugenda, A. G., & Mugenda, O. M. (2012). Research Methods Dictionary. Nairobi: Kenya Arts Press.
[12] Bartlett, J. E., Kotrlik, J. W., & Higgins, C. C. (2001). Organizational Research: Determining Appropriate Sample Size in Survey Research. Information Technology, Learning, and Performance Journal, 19, 43-50.
[13] Fraenkel, J. R., Wallen, N. E., & Hyun, H. H. (2012). How to design and evaluate research in education (8th ed.). New York: Mc Graw HIll.
[14] Cooper, D. (2000). Towards a model of safety culture. Safety Science, 36(2), 111-136.
[15] International Labour Organization. (2001). Guidelines on occupational safety and health management systems (ILO-OSH 2001). ISBN: 9221116344.
[16] Andersen JH, Malmros P, Ebbehoej NE, Flachs EM, Bengtsen E, Bonde JP. Systematic literature review on the effects of occupational safety and health (OSH) interventions at the workplace. Scand J Work Environ Health. 2019 Mar 1; 45(2): 103-113.
[17] Modica, M. 2007. Safe Science. Applying safety in a modern research laboratory. Professional Safety. American Society of Safety Engineers. July 2007.
[18] Perry, D. K., & Smalley, S. W. (2020). Effectiveness of Utilizing an Evidence Based Safety Curriculum to Increase Student Knowledge. Journal of Agricultural Education, 61(3), 294–307.
[19] Fleming, D. M. (2001) Safety Culture Maturity Model. Health and Safety Executive, Norwich.
Cite This Article
  • APA Style

    Miring’u, J., Gatebe, E., Karanja, B. (2024). Assessment of the Influence of Safety Training on the Technicians Safety Culture in the Pharmaceutical Manufacturing Industries in Kenya. Journal of Health and Environmental Research, 10(4), 134-148. https://doi.org/10.11648/j.jher.20241004.15

    Copy | Download

    ACS Style

    Miring’u, J.; Gatebe, E.; Karanja, B. Assessment of the Influence of Safety Training on the Technicians Safety Culture in the Pharmaceutical Manufacturing Industries in Kenya. J. Health Environ. Res. 2024, 10(4), 134-148. doi: 10.11648/j.jher.20241004.15

    Copy | Download

    AMA Style

    Miring’u J, Gatebe E, Karanja B. Assessment of the Influence of Safety Training on the Technicians Safety Culture in the Pharmaceutical Manufacturing Industries in Kenya. J Health Environ Res. 2024;10(4):134-148. doi: 10.11648/j.jher.20241004.15

    Copy | Download

  • @article{10.11648/j.jher.20241004.15,
      author = {Josephine Miring’u and Erastus Gatebe and Benson Karanja},
      title = {Assessment of the Influence of Safety Training on the Technicians Safety Culture in the Pharmaceutical Manufacturing Industries in Kenya
    },
      journal = {Journal of Health and Environmental Research},
      volume = {10},
      number = {4},
      pages = {134-148},
      doi = {10.11648/j.jher.20241004.15},
      url = {https://doi.org/10.11648/j.jher.20241004.15},
      eprint = {https://article.sciencepublishinggroup.com/pdf/10.11648.j.jher.20241004.15},
      abstract = {Introduction: Technicians in pharmaceutical manufacturing industries work in a high risk occupational setting. They are routinely exposed to chemical hazards due to the nature of their work. In order for them to perform, safety is paramount. This research intended to assess the influence of safety culture of technicians in pharmaceutical manufacturing industries. Methods: In order to achieve the objective, descriptive survey research design was used. Purposive sampling was used to select ten pharmaceutical Manufacturing industries which formed the research sample. Data was collected through questionnaires. The collected data was subjected to quantitative and qualitative analysis by use of SPSS. The results showed that the safety maturity level of 85% of the PMI’s were continually improving safety maturity level and only 15% in the involving safety maturity level. This was based on an analysis of the safety culture in four key dimensions. The study also established that majority of the respondents at 75.4% had their first encounter with OSH training at work environment commonly referred to as On the Job Training and only 23.3% were trained during their academic/professional education. The findings show that the majority of the respondents; 89.0 % and 80.8% of the respondents had been trained on the requirements of OSH Act 2007 and Evacuation procedures respectively. Notably, the training area with the least awareness was Exposure Limits of hazardous chemicals and substances at 29.1% across all PMI’s. The p values for OSH Training and Safe work documentation are pConclusion: The hypothesis, there is statistically significant influence of training on safety culture of technicians among pharmaceutical manufacturing industries in Kenya, was accepted. Therefore we can conclude that OSH training has a significant positive influence on safety culture in pharmaceutical manufacturing industries in Nairobi, Kenya. The study therefore recommends that there is need to incorporate an OSH competency in the professional training of potential employees in the PMI’s in Kenya. This will enhance awareness of hazards and shape attitudes towards safety, well in advance hence enhance the safety culture maturity levels. The government thought the Ministry Of Labour And Social protection should ensure frameworks are able to enforce the implementation of OSHA (2007) training requirements to fill the gap in the training topic on handling of hazardous chemicals for workers in the PMI’s.
    },
     year = {2024}
    }
    

    Copy | Download

  • TY  - JOUR
    T1  - Assessment of the Influence of Safety Training on the Technicians Safety Culture in the Pharmaceutical Manufacturing Industries in Kenya
    
    AU  - Josephine Miring’u
    AU  - Erastus Gatebe
    AU  - Benson Karanja
    Y1  - 2024/12/16
    PY  - 2024
    N1  - https://doi.org/10.11648/j.jher.20241004.15
    DO  - 10.11648/j.jher.20241004.15
    T2  - Journal of Health and Environmental Research
    JF  - Journal of Health and Environmental Research
    JO  - Journal of Health and Environmental Research
    SP  - 134
    EP  - 148
    PB  - Science Publishing Group
    SN  - 2472-3592
    UR  - https://doi.org/10.11648/j.jher.20241004.15
    AB  - Introduction: Technicians in pharmaceutical manufacturing industries work in a high risk occupational setting. They are routinely exposed to chemical hazards due to the nature of their work. In order for them to perform, safety is paramount. This research intended to assess the influence of safety culture of technicians in pharmaceutical manufacturing industries. Methods: In order to achieve the objective, descriptive survey research design was used. Purposive sampling was used to select ten pharmaceutical Manufacturing industries which formed the research sample. Data was collected through questionnaires. The collected data was subjected to quantitative and qualitative analysis by use of SPSS. The results showed that the safety maturity level of 85% of the PMI’s were continually improving safety maturity level and only 15% in the involving safety maturity level. This was based on an analysis of the safety culture in four key dimensions. The study also established that majority of the respondents at 75.4% had their first encounter with OSH training at work environment commonly referred to as On the Job Training and only 23.3% were trained during their academic/professional education. The findings show that the majority of the respondents; 89.0 % and 80.8% of the respondents had been trained on the requirements of OSH Act 2007 and Evacuation procedures respectively. Notably, the training area with the least awareness was Exposure Limits of hazardous chemicals and substances at 29.1% across all PMI’s. The p values for OSH Training and Safe work documentation are pConclusion: The hypothesis, there is statistically significant influence of training on safety culture of technicians among pharmaceutical manufacturing industries in Kenya, was accepted. Therefore we can conclude that OSH training has a significant positive influence on safety culture in pharmaceutical manufacturing industries in Nairobi, Kenya. The study therefore recommends that there is need to incorporate an OSH competency in the professional training of potential employees in the PMI’s in Kenya. This will enhance awareness of hazards and shape attitudes towards safety, well in advance hence enhance the safety culture maturity levels. The government thought the Ministry Of Labour And Social protection should ensure frameworks are able to enforce the implementation of OSHA (2007) training requirements to fill the gap in the training topic on handling of hazardous chemicals for workers in the PMI’s.
    
    VL  - 10
    IS  - 4
    ER  - 

    Copy | Download

Author Information
  • Directorate of Quality Assurance, Kenya Methodist University, Meru, Kenya

    Biography: Josephine Miring’u is a Biochemist, SHEQ Professional with extensive experience in the implementation of ISO Standards, including QMS, ISMS, EMS, and OSH. A long-standing Full Member of the National Quality Institute (KEBS), as well as an active Member of the ISO Technical Committee on Quality Assurance and Quality Management. Successfully led and managed the full implementation project cycle for ISO 9001 Quality Management System certification, from initial setup to final certification by Bureau Veritas, serving as the Management Representative and Project Team Leader projects in recent years.

    Research Fields: Occupational Safety & Health, Quality Assurance, Environment, Education

  • Ministry of Investment, Trade and Industry, Nairobi, Kenya

    Biography: Erastus Gatebe is currently the Industrialization Secretary, Ministry of Investment, Trade and Industry. He was the Chief Research Scientist at Kenya Industrial Research and Development Institute. He joined the Institute from Jomo Kenyatta University of Agriculture and Technology where he was a Professor of Environmental and Analytical Chemistry, was the technical head of research at the Institute, and oversees industrial research. He also has published over 50 publications in peer-reviewed journals and has successfully supervised over 40 postgraduate students. He was spearheading ISO certification of the clean cookstove laboratories at KIRDI in line with ISO 17025: 2017 and implementation of ISO 19867-1 test protocols while directing key research in the RE/clean cookstove sector. Professor Gatebe received his postgraduate studies from Eastern Illinois and Southern Illinois Universities in the United States and an undergraduate degree from Kenyatta University in Kenya.

    Research Fields: Environmental and Analytical Chemistry, Clean and Industrial Energy

  • Institute of Energy & Environmental Technology, Jomo Kenyatta University of Agriculture &Technology, Nairobi, Kenya

    Biography: Benson Karanja is a researcher and lecturer at Jomo Kenyatta University of Agriculture and Technology (JKUAT) in Kenya. Holding a BA, MSc, and PhD in Environmental Studies, Dr. Karanja specializes in environmental management, climate change adaptation, and occupational health and safety. Passionate about environmental issues, he actively champions community-focused initiatives. Through his academic and research endeavors, he continues to drive sustainable development and inspire positive environmental action. He currently serves on the Editorial Boards of numerous publications and has been invited as a Keynote Speaker, Technical Committee Member and Session Chair, at international conferences.

    Research Fields: Environmental and Energy

  • Abstract
  • Keywords
  • Document Sections

    1. 1. Introduction
    2. 2. Materials and Methods
    3. 3. Results
    4. 4. Discussion
    5. 5. Conclusions
    Show Full Outline
  • Abbreviations
  • Acknowledgments
  • Author Contributions
  • Appendix
  • Data Availability Statement
  • Conflicts of Interest
  • References
  • Cite This Article
  • Author Information